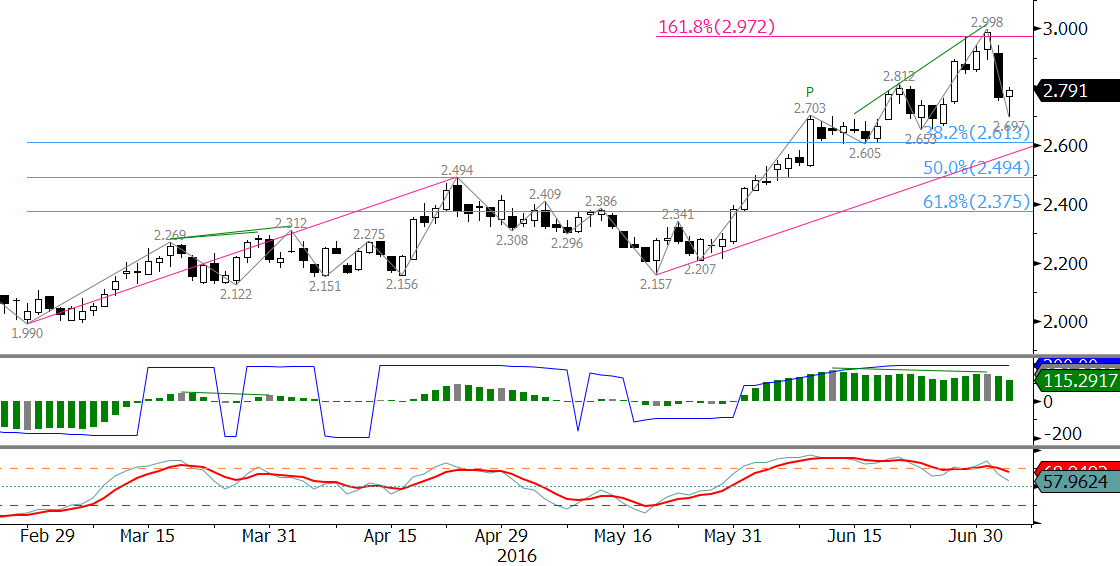
August natural gas stalled at $2.998 late last week. So far, August has pulled back to $2.697. The $2.998 swing high was in line with the 1.618 projection of the wave $1.99 – 2.494 – 2.157. From a technical standpoint, the move up was due for a correction. Momentum was exhausted and the bearish KasePO divergence indicates the correction that began Tuesday should now challenge major support levels.

Longer-term, the outlook for natural gas is positive. The move up looks to be forming five-waves. Wave III of the five-wave pattern was completed at $2.998. The corrective Wave IV is now underway. A normal correction should hold $2.61, the 38 percent retracement from $1.99 to $2.998. The $2.61 level was also strong support between June 10 and 17.
A close below $2.61 would open the way for a more significant correction. However, the longer-term bullish outlook would not be called into question unless there is a sustained close below $2.38. This is the 62 percent retracement of the move up from $1.99. Such a move is highly doubtful without a significant bearish shift in underlying fundamentals.
Wednesday’s hammer formation indicates the move down may halt to a grind lower. A test of Tuesday’s $2.84 midpoint will likely take place on Thursday. Key resistance is $2.88. This is the 62 percent retracement from $2.998 to $2.697. While $2.88 holds, odds will continue to favor a deeper correction.
This is a brief natural gas forecast for the next day or so. Our weekly Natural Gas Commentary and intraweek updates provide a much more detailed and thorough analysis. If you are interested in learning more, please sign up for a complimentary four-week trial.


