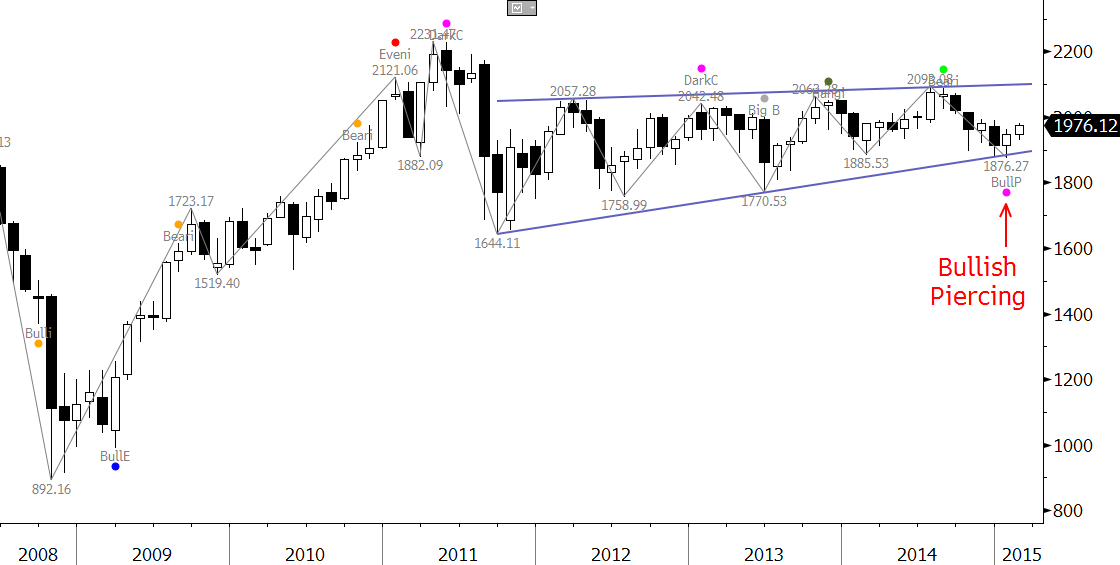
Since late 2011 the Korean Stock Exchange (KOSPI) has oscillated in a narrowing range, now nearing its apex, which means a breakout is expected within the next quarter or two, perhaps sooner.
The pattern began after 2011’s decline to 1644.11. The entire pattern could be the middle “B” wave of a downward ABC correction, or, alternatively the first wave of a renewed push higher. This will remain an open question until there’s a break out, but recent technicals call for a test the formation’s upper trend line. So odds may indeed favor a break higher.
KOSPI Monthly

The first positive factor is a bullish piercing pattern that formed after a test of the pennant’s lower trend line, when January opened below December’s close and closed above December’s midpoint. If February, now trading slightly over December’s 1971.95 open, closes above that point, the bullish tone will be confirmed.
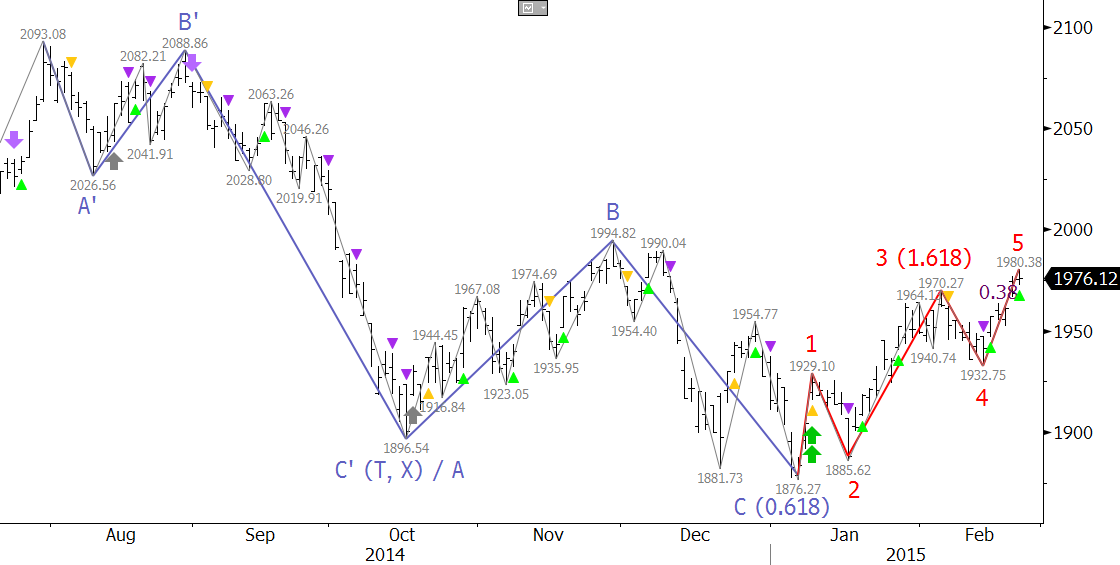
The next bullish factor for this KOSPI forecast can be seen on the daily chart, in red. This is a five-wave trending pattern that met a major target at 1970.27 (the top of Wave 3), and is now poised to extend to key endpoint targets for Wave 5, at 2039.6. Early in the move up a strong buy signal called a pierced dart (two green up arrows and yellow triangle) triggered on the KaseX trading study.
KOSPI Daily

Hitting 2039.6 would be extremely important because the KOSPI Index would have overcome the top of Wave B, marked in blue. To be considered complete, waves must extend to at least their 0.618, or smaller than, projection. This value was met at 1876.27. Kase’s studies show that just 13 percent of waves stall at this level, the remainder go on to meet their equal to, or 1.0 projection. Overcoming 1994.82 would wipe out Wave C. At that point, the entire wave down from 2093.08 would have to extend down as a whole. Alternatively the wave would be considered complete at the minimum extension, potentially a bearish technical failure.
A bearish failure often results in a sharp rise. Therefore, overcoming 1994.82 could be the catalyst that the KOSPI Index needs to make a decisive upward move.
2039.6 has about 2/3rds odds to be met, and would likely trigger connections to 2158.2 from the waves up from 1644.11. At that point, the resistance line will have been broken. Waves up from 892.16, which also point to 2158.2, might then extend to higher targets at 2336.2 and 2484.3.
In summary, while KOSPI has been oscillating in a neutral range, 2039.6 is the key for an upside test. There could be a pullback at 2039.6, but a sustained close over this, calls for 2158.2, above the upper trend line. A sustained close over this would confirm a valid break higher and open the way for the 2336.2 and 2484.3 targets.
Learn more about Kase’s trading indicators KaseX and Kase StatWare that were used for this KOSPI forecast.
Take a trial of Kase’s weekly energy forecasts that use the same techniques as this KOSPI forecast.

