Crude Oil Forecast: WTI’s Correction Gains Ground

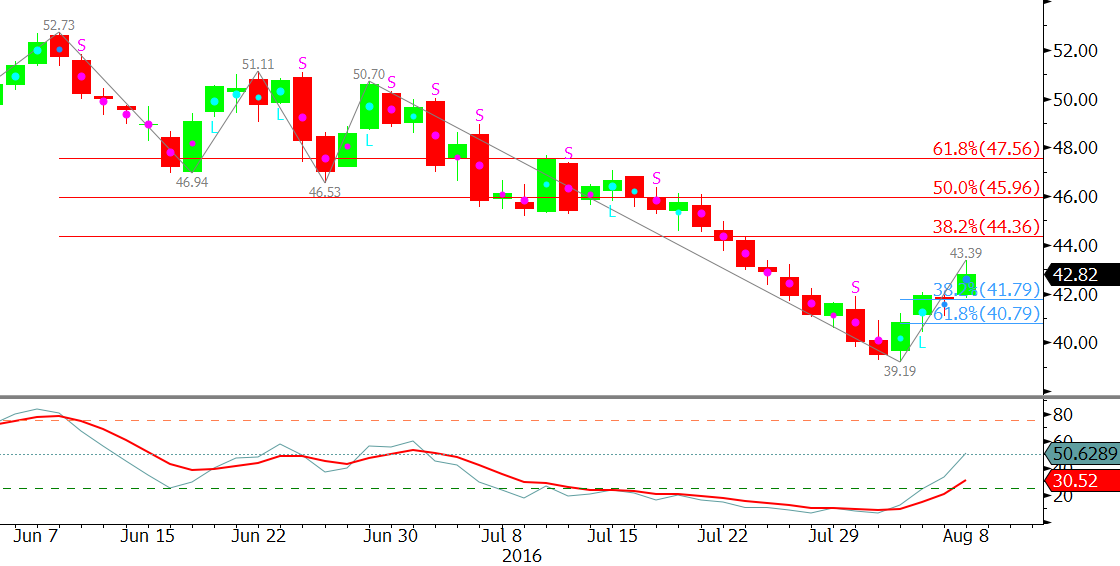
September WTI crude oil’s correction up from $39.19 gained ground on Monday when it settled above $42.8. Media outlets indicate the rise was due renewed hopes that OPEC members might consider freezing production levels. OPEC announced on Monday that they would hold informal talks at an energy conference in September.

That said, from a technical perspective, the move down was due for a correction. September WTI briefly moved into bearish territory last week when it settled below $40.4. However, a highly confluent and important $39.2 target held when the $39.19 swing low was made. The Stochastic has since risen out of oversold territory, and several intraday charts confirmed bullish momentum divergences.
CLU6 20160808

Friday’s hanging man candlestick pattern was negative by Monday’s close over $42.8. This opens the way for $44.4. This is the 38 percent retracement of the decline from $52.73 to $39.19 and an important decision point for the near-term. If the move down is going to continue within the next few weeks, $44.4 should hold. However, a close over $44.4 would call for an extended correction and could be an early indication that another long-term bottom has been made.

As the move up extends over the next few days, look for near-term support at $42.5, $41.8, and $40.8. The $42.5 level will probably be tested early Tuesday, but should hold. This is near Monday’s midpoint. Key support is $40.8 because it is the 62 percent retracement of the move up from $39.19. A close below this would shift odds in favor of testing $39.19 again.

This is a brief analysis and outlook for the next day or so. Our weekly Crude Oil Commentary and intraweek updates are a much more detailed and thorough energy price forecast. If you are interested in learning more, please sign up for a complimentary four-week trial.

The U.K.’s vote for Brexit came as a shock to many investors and traders around the world. Equity markets have tumbled and crude oil followed suit as the U.S. dollar has risen substantially. Some pundits think the downturn in oil has been overdue, and warn that the market is still oversupplied and could slip further in coming weeks and months. Others hold the recovery will continue and that the decline is likely an overreaction to Brexit.

It is clear that sentiment is mixed. However, charts tell a clearer story. The long-term bias is positive, and ultimately odds still favor the move up. However, the downward correction is poised to continue for the near-term.

Negative Factors

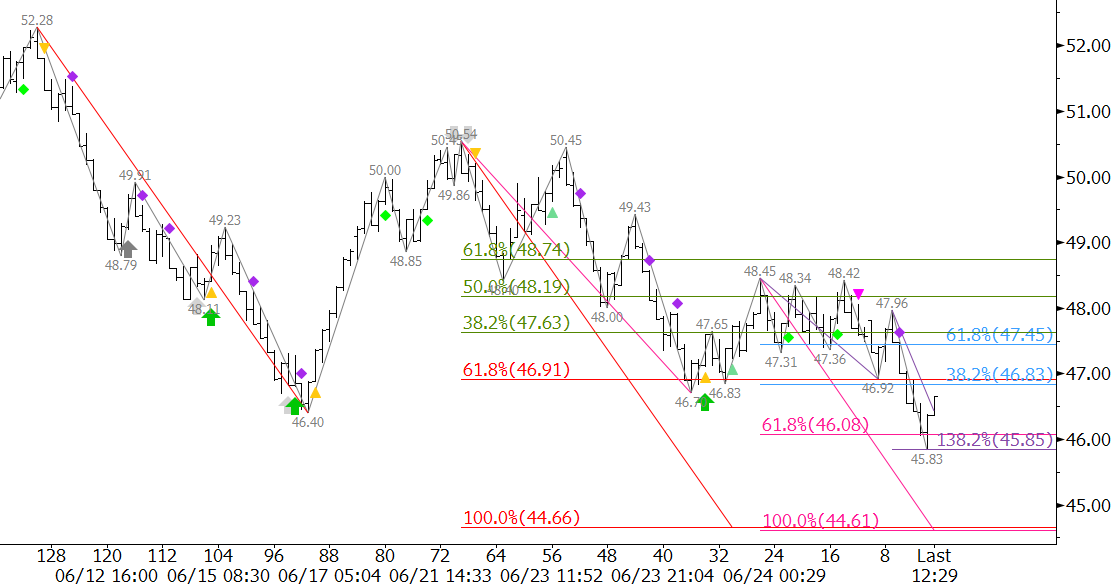
August WTI met confluent support near $46.0 on Monday. This was in line the 0.618 projection of the wave $50.54 – 46.7 – 48.45 and 1.382 projection of the wave $48.45 – 46.92 – 47.96. Near-term odds favor a decline to at least $44.7, the 1.00 projections of the waves $52.28 – 46.4 – 50.54 and $50.54 – 46.7 – 48.45. This is a very important target and decision point for WTI. A close below $44.7 would open the way for targets in the low $40s. It is at those targets that the market will need to decide whether the move up will continue or a long-term bearish outlook would be adopted again.

CLQ6 20160627

Positive Factors

The upward correction that began late Monday afternoon may extend to $46.8 and even $47.5 in early trading Tuesday. However, $47.5 should hold. A close over $47.5 would call for a test of key resistance levels above $50.0, that if overcome, would indicate the downward correction is over.

This is a brief analysis and outlook for the next day or so. Our weekly Crude Oil Commentary is a much more detailed and thorough energy price forecast. If you are interested in learning more, please sign up for a complimentary four-week trial.
The falling U.S. dollar and higher probability the U.K. will vote to remain in the European Union are reportedly causes for crude oil’s recovery. However, some analysts have stated that increasing U.S. rig counts and production coming back online in Canada will keep a lid on oil prices for the near term.

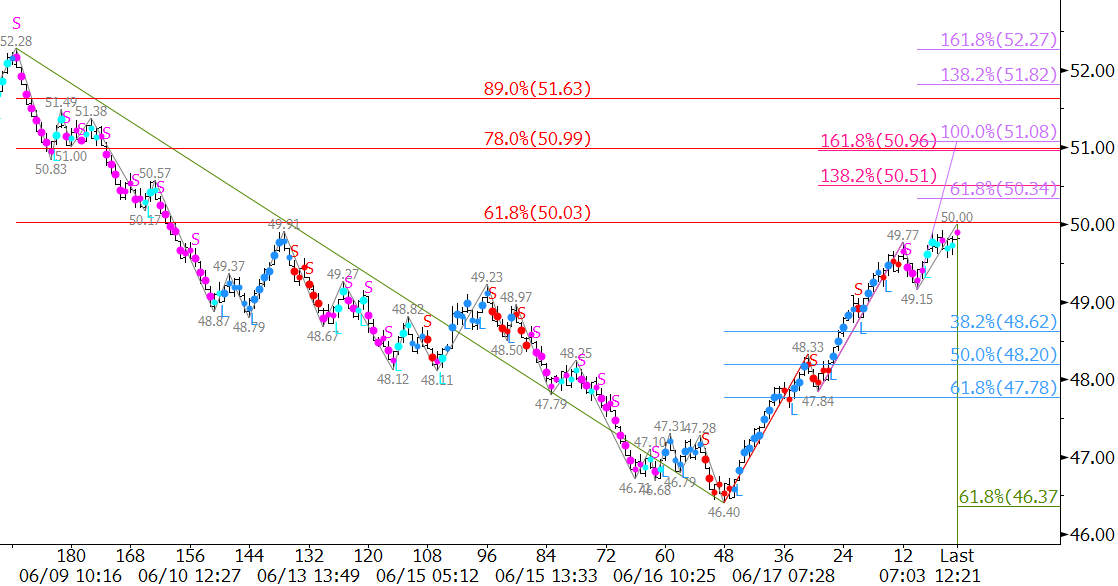
August WTI crude oil met crucial support at $46.41 on Friday before turning higher and forming a daily bullish engulfing line. So far, the move up to $50.0 has retraced 62 percent of the decline from $52.28 to $46.4. A close over $50.0 would significantly increase odds for $51.0 and possibly $52.3 later this week.

CLQ6 20160620

Support at $48.6 will most likely hold. The key level for the next few days will be $47.8. These are the 38 and 62 percent retracements from $46.4 to $50.0, respectively. A close below $47.8 would indicate the move up has likely formed Wave B of a larger scale ABC correction. This would in turn open the way for the downward correction to extend to targets in the mid-to-low $40s.

This scenario is less likely given the strong price rise over the past few days. With all factors considered, crude oil will most likely settle into a range in the upper $40s and low $50s soon while it sorts through the conflicting geopolitical, fundamental, and technical factors.

This is a brief analysis and outlook for the next day or so. Our weekly Crude Oil Commentary is a much more detailed and thorough energy price forecast. If you are interested in learning more, please sign up for a complimentary four-week trial.
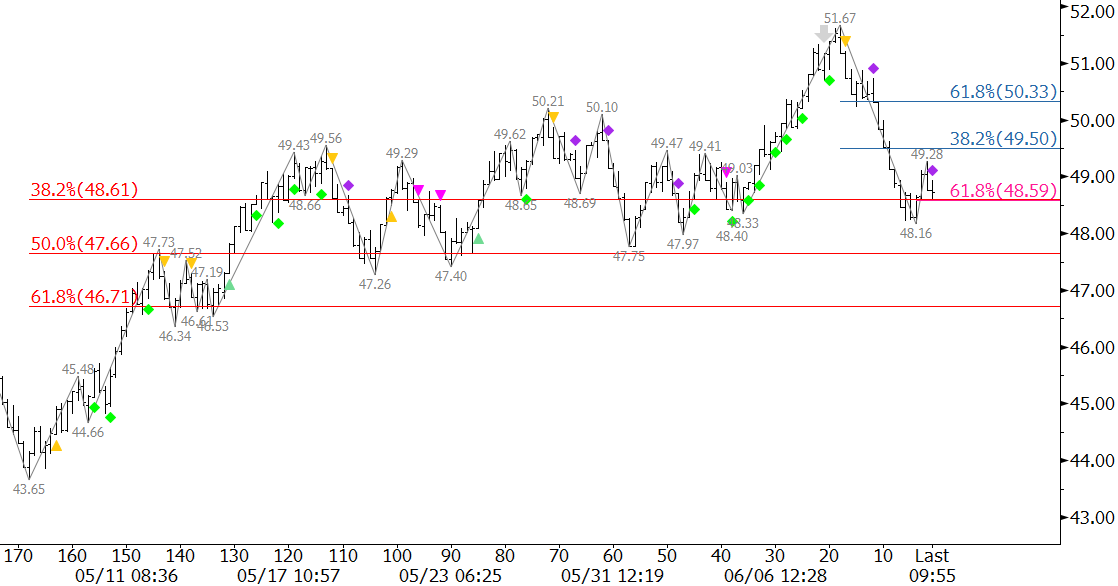
As WTI crude oil prices fall from the recent $51.67 high, some reports indicate the pullback is due to the rising U.S. dollar and increased rig counts for the second week in a row. Pundits have also stated the sharp price surge could encourage some producers to increase production, keeping the market oversupplied. Others still believe recent supply disruptions in Canada and Nigeria will be supportive.

From a technical perspective, WTI’s move up had become extended and was due for a correction. The confirmed dark cloud cover, bearish daily divergences, weekly shooting stars, and monthly evening star setups indicate the majority of technical factors are negative for the near-term.

Support at $48.6 was challenged Monday, but held on the close. A move below $48.6 in early trading Tuesday would open the way for at least $47.7 and possibly $46.7. Both targets are near major swing lows that may hold initially. Therefore, we expect the move down will be choppy as it unfolds over the next few days.

CLN6 20160613

There is a modest chance that Tuesday’s morning star setup will test Friday’s $49.8 midpoint first. This is near the 38 percent retracement of the decline from $51.67 to $48.16 and the 1.00 projection of the small wave up from $48.16. Key resistance is $50.3. This is the 62 percent retracement and 1.618 projection. Resistance at $50.3 is expected to hold. A close over $50.3 would call for prices to retest the $51.67 swing high.

This is a brief analysis and outlook for the next day or so. Our weekly Crude Oil Commentary is a much more detailed and thorough energy price forecast. If you are interested in learning more, please sign up for a complimentary four-week trial.
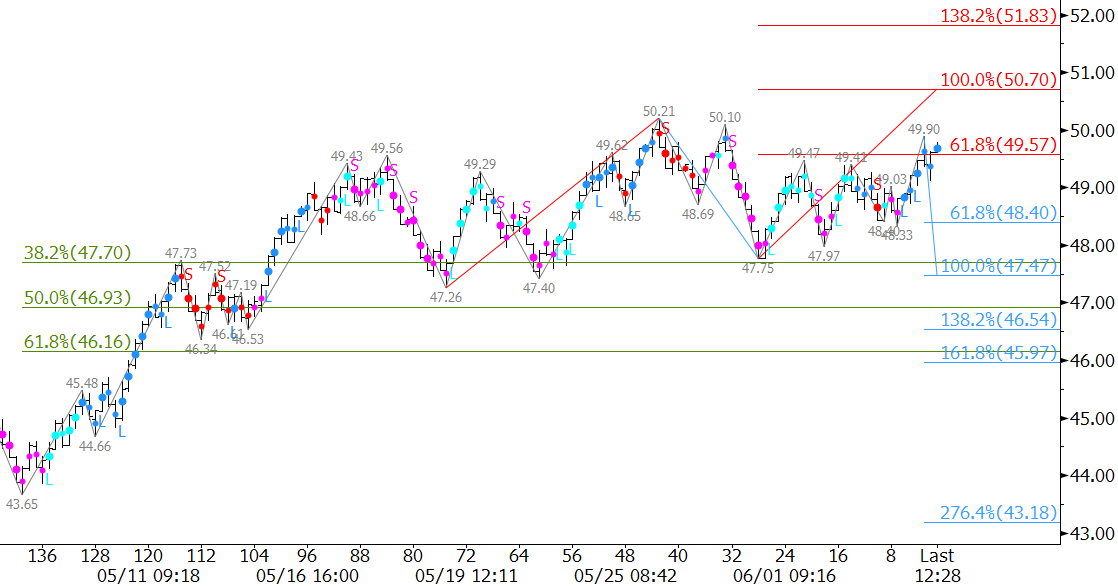
For the past few weeks, WTI crude oil has been trading in a tight range as it tries to sort through recent events and fundamental factors. Reports indicate Monday’s close at a 10-month high was due to concerns over continued supply disruptions and speculation that the Federal Reserve will not raise interest rates this month.

From a technical perspective, the recent wave formations show that prices are poised to rise to targets above $50.0 over the next few days before reaching the next major decision point in the mid-$50s. July WTI closed above the 0.618 projection of the wave up from $47.26 on Monday. Waves that overcome the 0.618 projection typically extend to at least the 1.00 projection, in this case $50.7. Therefore, odds favor a test of $50.7. A close over $50.7 would call for $51.8 and possibly higher this week.

CLN6 20160606

Support at $48.4 should hold. This is the 0.618 projection of the wave down from $50.21. It is also near the 62 percent retracement of the move up from $47.75 to $49.9. A close below $48.4 would call for a test of $47.5, which is near the bottom of the recent trading range. A close below this would open the way for an extended correction to $46.2 and possibly lower.

This is a brief analysis and outlook for the next day or so. Our weekly Crude Oil Commentary is a much more detailed and thorough energy price forecast. If you are interested in learning more, please sign up for a complimentary four-week trial.
Reports indicate traders and investors have been focused on the return of crude oil from recent worldwide supply disruptions, primarily in Canada and Nigeria, in addition to swelling output from Iran. The rising U.S. dollar has also put bearish pressure on prices after the Fed’s latest policy meeting notes suggested a June rate hike possible.

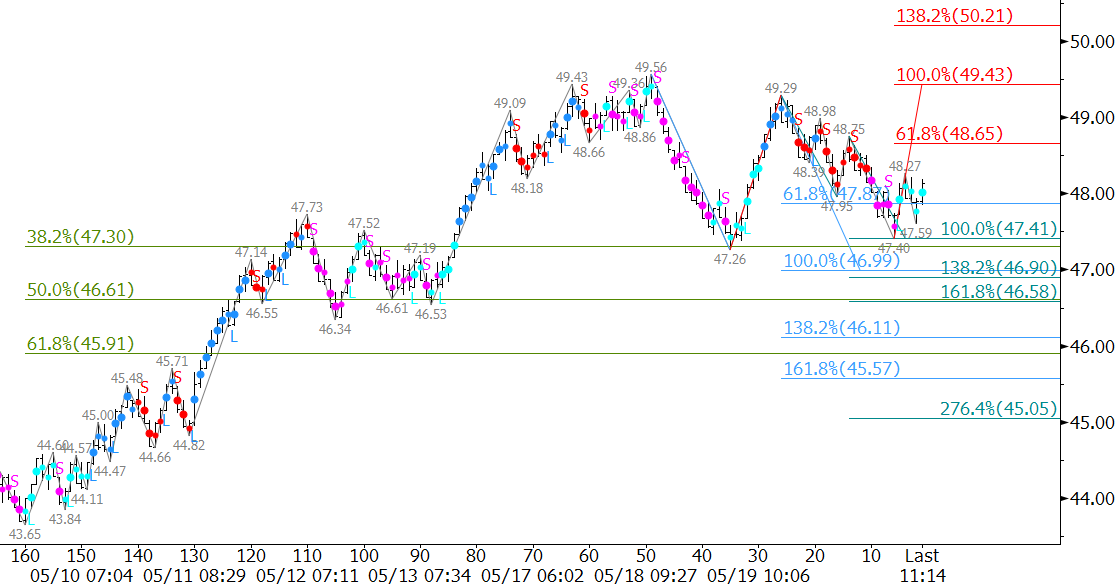
From a technical standpoint, WTI reached significant targets just below $50.0 late last week before forming daily bearish divergences and daily hanging men. These factors indicate the move up is exhausted. However, so far, July WTI’s decline from $49.56 has been extremely choppy and is most likely corrective.

The correction has held the 38 percent retracement from $43.65 to $49.56, but is positioned to extend a bit lower. There is highly confluent support at $46.8, which will likely be met before the move up continues. A close below $46.8 would call for an extended correction to $45.6.

CLN6 20160523

That said, the move up from $47.4 on Monday shows that prices should test $48.6 early Tuesday before attempting $46.8 again. This level should hold, but a close over $48.6 would open the way for $49.2. A close over $49.2, would indicate the downward correction is most likely over and call for $50.2 and higher.

In summary, look for a test of $47.4 followed by $46.8. A close beyond either of these levels will give the market a better sense of near-term direction and how low the correction will extend before prices ultimately turn higher again.

This is a brief analysis and outlook for the next day or so. Our weekly Crude Oil Commentary is a much more detailed and thorough energy price forecast. If you are interested in learning more, please sign up for a complimentary four-week trial.
Supply disruptions due to wildfires in Alberta and militant attacks in Nigeria were reportedly offsetting rising stockpiles of crude oil and surging OPEC output. However, those factors seem to be easing, and may not have as much of an impact on supply as originally indicated.

U.S. crude inventories reached their highest level since 1929, but rig counts continue to decline and U.S. output reportedly dropped the most in eight months during the week ended April 29.

Some analysts and traders believe the move up may have been too much too fast, and that the market is taking a much needed breather after rising four weeks in a row prior to last week. Sentiment is also becoming more negative, indicating the move down should extend.

June WTI crude oil challenged key resistance at $46.1 a few times over the past several days. This level has held so far, and should continue to hold as the corrective move down extends. The wave formations down from $46.78 and $46.07 indicate June should decline to at least $42.5. This is a confluent wave projection and the last major swing low. A close below $42.5 would call for $42.0 and lower.

crude oil
crude oil

That said, at this point, we do not foresee that prices will fall apart. We expect trading to remain choppy. Look for $44.3 to hold upon a test of resistance early tomorrow before the decline continues. Crucial resistance for tomorrow is $44.9. We doubt prices will rise this high unless spurred by random events. Key resistance remains $46.1. A close above $46.1 would indicate the correction is over, and in turn, open the way for the next leg higher.

This is a brief analysis and outlook for the next day or so. Our weekly Crude Oil Commentary is a much more detailed and thorough energy price forecast. If you are interested in learning more, please sign up for a complimentary four-week trial.

The crude oil price surge over the last few weeks was reportedly due to slipping U.S. production, a weaker U.S. dollar, and several production outages. However, some pundits are growing concerned that swelling OPEC output could keep the market oversupplied and turn prices lower.

The move up stalled near a highly confluent $46.0 target late last week, and June WTI challenged crucial support at $44.5 on Monday. This is near the 1.00 projection of the wave $46.78 – 45.24 – 46.15, and is in line with the prior swing high of $44.49.

CLM6 20160502
crude oil

In addition, Friday’s bearish Harami line and star was confirmed and several bearish divergences were triggered on Monday.

At this point, there is no strong technical evidence that the pullback will end. Therefore, the move down should extend to at least $43.7, $42.9, and possibly $41.9 over the next few days

That said, at this point the move down is corrective, and unless the $42.5 swing low is taken out, longer-term odds will favor the move up. A close over the $46.15 swing high will shift near-term odds back in favor of $48.0.

This is a brief analysis and outlook for the next day or so. Our weekly Crude Oil Commentary is a much more detailed and thorough energy price forecast. If you are interested in learning more, please sign up for a complimentary four-week trial.
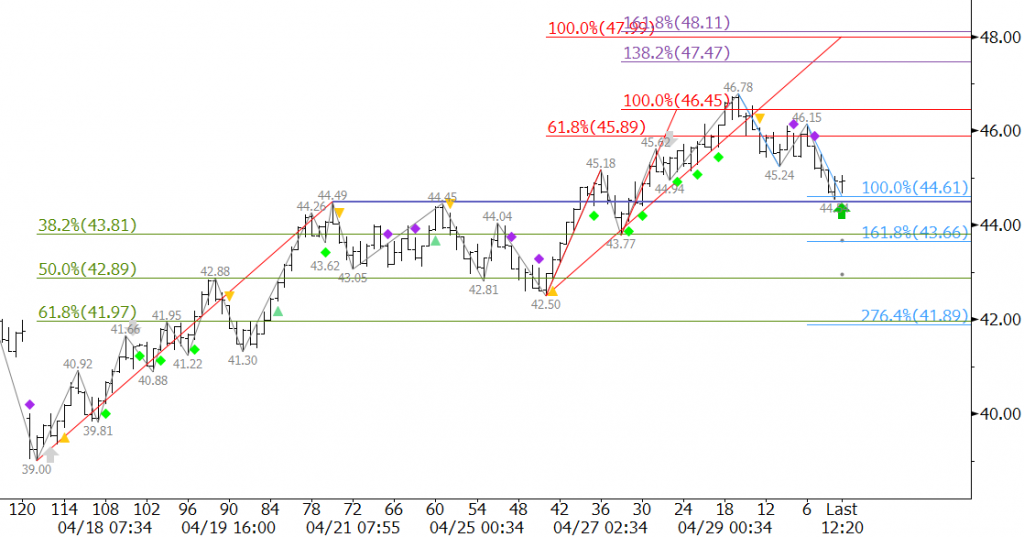
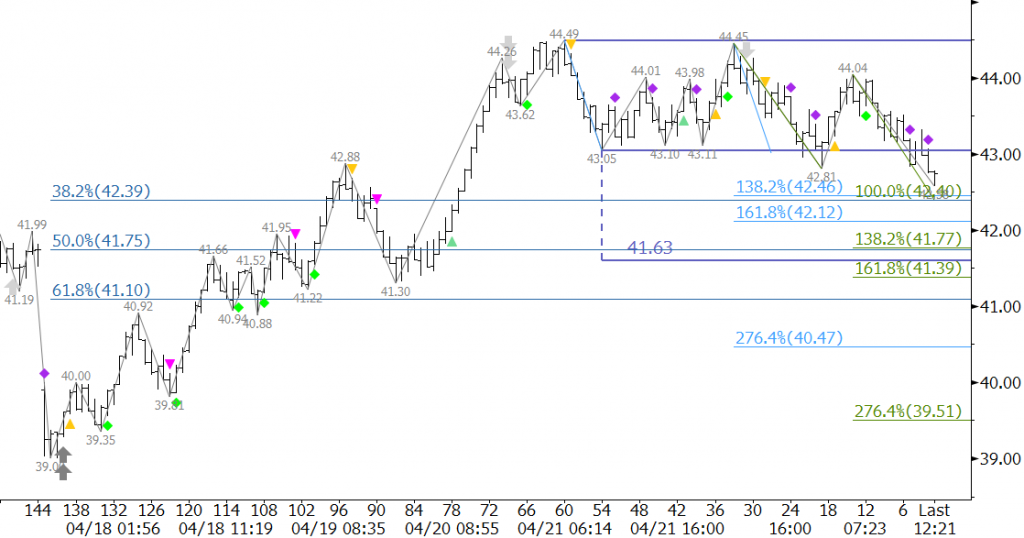
Late last week, June WTI crude oil challenged key resistance at $44.5. This is a confluence point, and most importantly, the 1.618 projection of Wave I (not shown), $30.79 – 38.52 – 32.1. A close over $44.5 will open the way for the next leg higher, which could push WTI crude oil prices into the upper $40s and possibly the low $50s.

That said, a small double top formed near $44.5 on Friday and was confirmed Monday upon the close below $43.05. The confirmed double top and waves down from $44.49 and $44.45 call for the pullback to extend to at least $42.1 and likely a confluence area near $41.6.

CLM6 20160425
crude oil

The move down has been shallow and choppy though, indicating it is most likely corrective of the move up. Unless $41.6 is taken out on a sustained closing basis, we still expect prices to attempt to overcome $44.5 again. A move above $43.3 in early trading tomorrow would call for $43.8 and possibly $44.5.

This is a brief analysis and outlook for the next day or so. Our weekly Crude Oil Commentary is a much more detailed and thorough energy price forecast. If you are interested in learning more, please sign up for a complimentary four-week trial.
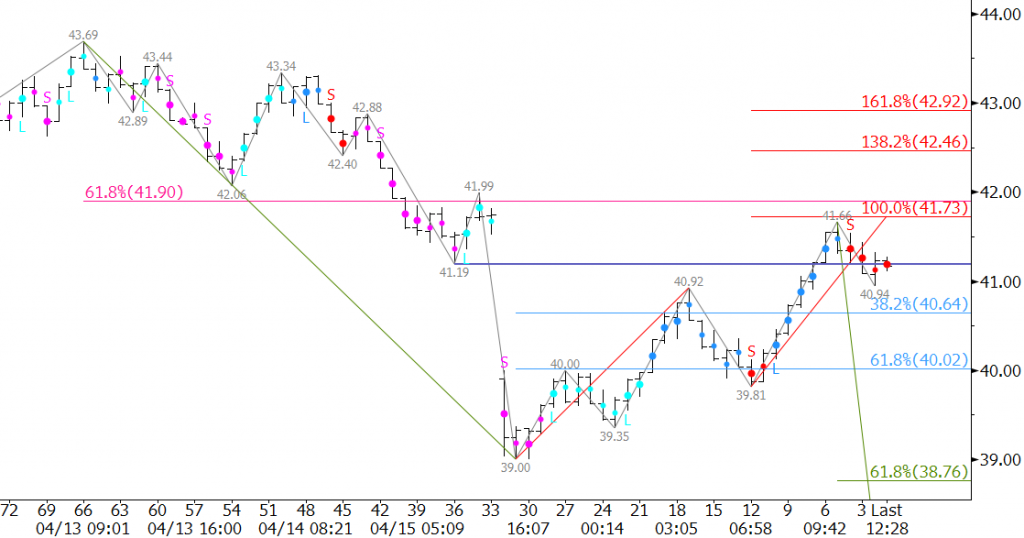
The failure to reach an agreement to freeze crude oil output levels for key producers caused prices to slide in early trading Monday. June WTI gapped down from Friday’s $41.19 low and met crucial support at $39.0. However, the labor strike in Kuwait, which has decreased the nation’s output by nearly 60 percent for the second straight day, lent support to the market. June WTI rose to $41.66 and settled at $41.19 on Monday.

The bounce to $41.66 filled the gap and fulfilled the 1.00 projection of the wave $39.0 – 40.92 – 39.81. The move up may gather some strength from the strike in Kuwait and extend a bit higher on Tuesday. However, from a technical standpoint, the move up from $39.0 was not unusual. Gaps are usually filled, and as stated, the move up from $39.0 has already met technical resistance near $41.66.

CLM6 20160418
crude oil

Without support from bullish fundamentals or further random events (such as the strike in Kuwait), we expect prices to grind their way lower to support at $40.6 and $40.0 over the next few days. $39.0 remains key, and a close below this would open the way for major support in the mid $30s.

That said, a close over $41.7 would call for $42.5 and possibly $42.9. At this point, we don’t expect to see prices rise above $42.9.

This is a brief analysis and outlook for the next day or so. Our weekly Crude Oil Commentary is a much more detailed and thorough energy price forecast. If you are interested in learning more, please sign up for a complimentary four-week trial.