How is Technical Analysis Used?

Technical analysis is technical. This means there are mathematics, charts, and statistics involved. Some interested in studying and using technical analysis are dismayed when they encounter numbers and charts. A math, engineering, science, or financial degree is not required to make use of technical analysis. However, an orientation towards structuring a view of reality mathematically is helpful.

Some people think technical analysis is a way to quickly make a lot of money, become a hotshot trader, or a means to finding the “Holy Grail” of trading systems. Technical analysis is certainly a means to success, but there is no way to get around the need for commitment and perseverance. Success in using technical analysis, like any endeavor, will take hard work, commitment, and perseverance.

The Four Aspects of Technical Analysis

When using technical analysis there are four basic applications: instrument selection, timing trade entries and exits, managing risk, and forecasting.

Technical analysis can be used to select instruments to trade. For instance, if a trader wanted to scan the 1,000 most active stocks and pick the instrument most likely to take a sharp turn, they could use technical momentum indicators such as the MACD or RSI to look for divergence. Divergence is a momentum signal that is triggered when a trend is exhausted. If a divergence occurs, it is likely that the instrument is getting ready to turn in a statistically significant manner. The trader can then decide to further analyze and possibly trade that instrument.

Once a trader has selected an instrument they can use technical analysis to determine the instrument’s direction, strength and extent of potential trends, support and resistance levels, potential turning points, and risk.

Technical analysis is, as the name implies, a study or examination of the market. The analogy commonly used in technical forecasting is that it is similar to cartography or map drawing. In other words, you are drawing a map of how to get from point A to point B.

Once the map has been drawn and the forecast is complete a trader can use technical indicators, geometric formations, and other methods of analysis to determine entry and exit point for the market. This is called market timing, and is one of the greatest strengths of technical analysis.

Example of Using Technical Analysis

In the daily chart below as natural gas prices fell to new price swing lows the RSI momentum indicator was making higher lows. This was a clue that the decline was exhausted and that a significant turn higher was about to take place. A trader with a short position would possibly cover the positon once the divergence was confirmed (green trend lines).
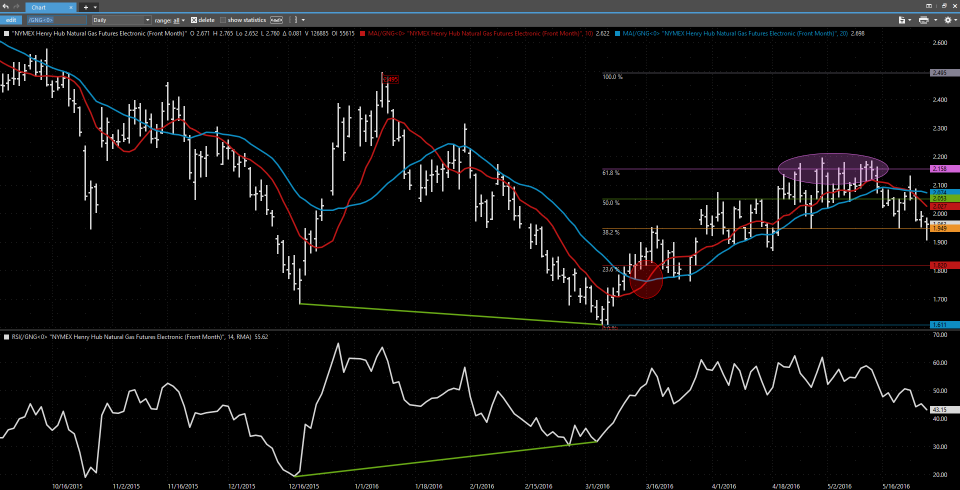
NG Daily RSI Divergence

After covering the short trade, the trader could then time a long entry when the 10-period moving average (red line) crossed above the 20-period moving average (blue line). This crossover is shown within the red circle. When the fast moving average (10-period) rises above the slow moving average (20-period) it suggests the move up should continue because there has been an upward shift in momentum.

Once the long trade has been taken, the trader can then begin to identify resistance levels using other methods of technical analysis. In the example above, a series of Fibonacci retracements from the $2.495 swing high to the $1.611 swing low are shown to the right of the chart. The 38.2, 50, and 61.8 percent retracement levels of this move were identified as resistance well ahead of being met. Note that at each of these levels a small turn lower or trading range took place. Ultimately, the move up held near the 61.8 percent retracement (pink ellipse) and turned lower again.

Conclusion

Technical analysis is a means of analyzing and interpreting what the market knows about itself. As discussed, the tools within the practice of technical analysis are useful for instrument selection, timing trade entries and exits, managing risk, and forecasting. By learning and using technical analysis, one can become a better trader by gaining a deeper level of insight into the markets they trade.


Kase’s president Cynthia A. Kase is featured in a podcast interview with Marie Grace Berg of Today’s Leading Women.

Listen to Ms. Kase’s interview on iTunes and give it a rating, or click the link below to listen on the Today’s Leading Women website.

Episode 634: Learn Trading and Forecasting Techniques with Cynthia Kase

Cynthia-Kase-of-Kase-Company-e1447283745788


5c1050e7d305921d3b87cdb35a1e42ffby

Read on TraderPlanet

“Ask Kase” and your question may be chosen as the subject of a future column (askkase@kaseco.com).

With VW cheating on diesel fuel emissions and standards being scrutinized worldwide, interest in electric vehicles may increase longer-term, and medium-term, gasoline fueled vehicles might pick up. But will gasoline prices get a boost any time soon? Probably not.

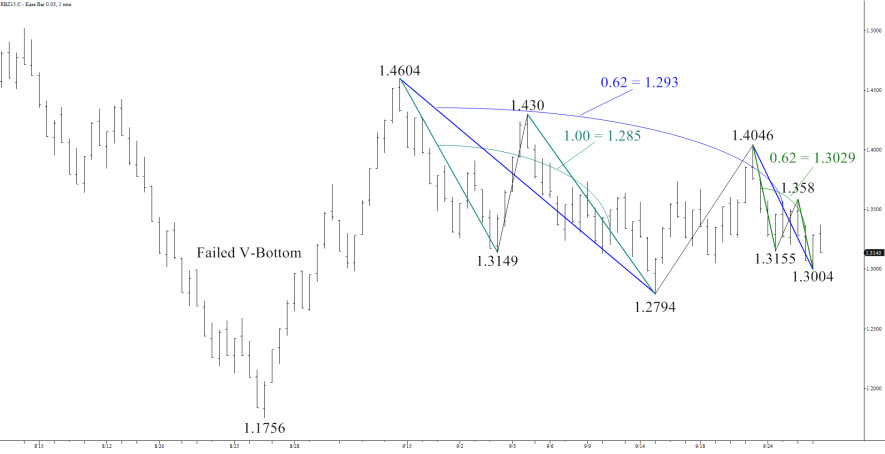
December gasoline, which becomes prompt in two days, traded up to $1.4604 at the end of August. Since then it’s been caught in a downward oscillating pattern, but remains above its earlier $1.1756 low.

Odds favor the downside. This was a large down month which prevented a bullish reversal pattern from completing. On the daily chart, the decline to and bounce up from $1.1756 was a bullish V-bottom but failed. The decline from $1.4604 was interrupted by a bullish flag which has since broken lower. The perpetual has been steadily dropping since mid-June, only going into a sideways stall during the past two weeks.

RB-Fig1

Charts created using TradeStation. ©TradeStation Technologies, Inc. 2001-2015. All rights reserved. No investment or trading advice, recommendation or opinions are being given or intended.

Odds of a recovery are higher than for a normal trending market. The decline from $1.4604 only met the minimum 0.62 extension. The decline has also been shallow.

Two very strong layers of support are $1.235 and $1.205, respectively the 78 percent and 89 percent retracements of the $1.1756 to $1.4604 rise. $1.235, less than one cent above the perpetual’s January low, is important because it’s only generated by the waves down from $1.4604. For the six waves down from this price, $1.235 is a wave extension for five, and as a corrective projection for three. Thus, should $1.235 hold, there is no connection to larger, earlier waves which project to lower levels. The next layer at $120.5 connects back to the mid July $1.5828 high. This support level could engender a trading range between the $1.20s and $1.50s, so watch out for that.

Even though the previous low of $1.1756 is natural support, a close below $1.205 could trigger a steep decline down to $1.06. This is because the wave extensions tie the two prices together. The wave 158.28 – 117.56 – 146.04 targets $1.205 as the 0.62 extension and $1.06 as the equal, 1.0, extension. 140.46 – 130.04 – 133.73 targets $1.205 as the 1.38 extension and $1.06 as the 2*1.38 extension. The point is that should there be a close below $1.205, the pull from $1.06 grows.

Adding to that pull is that $1.06 is the 89 percent retracement of the move up from the 2008 low of $0.785 to 3.48. Hitting $1.06 could cause a slide below the $1.00 level.

So watch to see if the two targets in the $1.20s hold – or not.

A close over $1.375 would argue for concern that the move up from $1.1756 will extend. That’s the price above which I wouldn’t hold short-term short position. Above $1.4604 the contract is in for a further recovery. Either way, moderate prices, well below prices should prevail. So fill up the tank, and get on the road before December snows slow you down!

Send questions for next week to askkase@kaseco.com, and click the link to learn more about Cynthia Kase’s latest video series, Kase on Technical Analysis.

By Dean Rogers

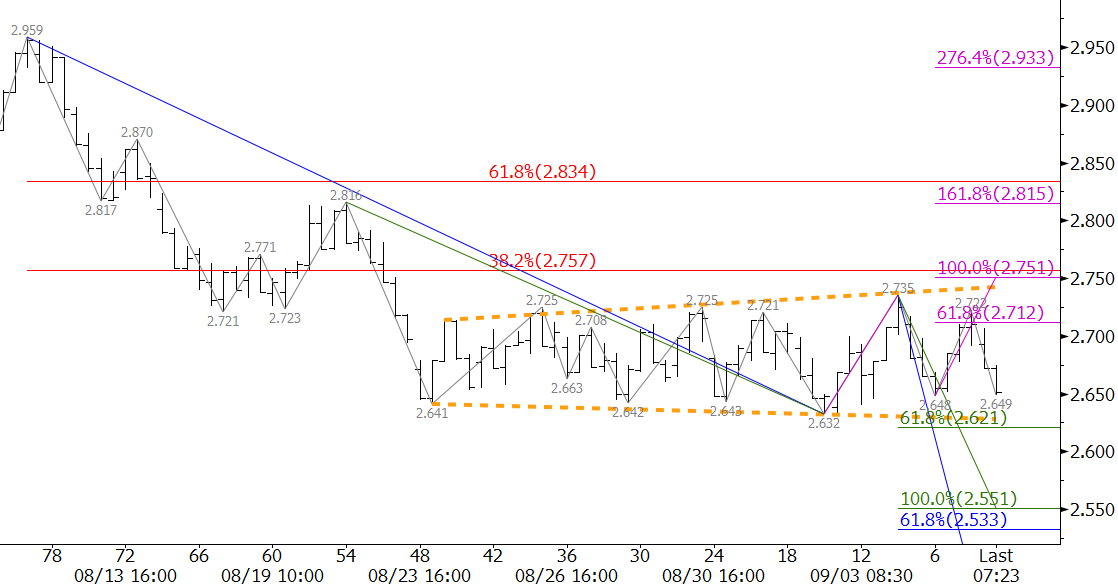
Natural gas had oscillated in an expanding triangle since August 24. Monday’s break higher out of the pattern was positive, but stalled at $2.794, the 50 percent retracement from $2.959 to $2.632.

The move to $2.794 was healthy because the decline had become stale. The rally gave bears a new opportunity to short the market.

Tuesday’s close below Monday’s $2.73 midpoint formed a daily dark cloud cover (bearish), and Wednesday’s close below $2.70 confirmed the pattern. This is also in line with the 62 percent retracement from $2.632 to $2.794.

natural gas

Caution is warranted and trading will likely remain choppy, but the bearish technical factors indicate another test of $2.63 is expected. A close below this would open the way for the decline to $2.55 and lower have expected for several weeks.

This is a brief natural gas forecast ahead of tomorrow’s EIA report. Our weekly Natural Gas Commentary is a much more detailed and thorough analysis. If you are interested in learning more, please sign up for a complimentary four week trial.

By Big Hotel ImageCynthia Kase

Read on TraderPlanet.com

The big hotel chains recovered from the financial crisis well and until recent months showed steady gains. Diversification, appealing to differing guests, as well as shifting property ownership to partners helped heat the sector. But now, it looks like supply is catching up with demand, and now the sector is cooling off. To evaluate specifics, I’ve chosen to look at Starwood Hotels & Resorts Worldwide Inc. (HOT) this week as a proxy for its peers.

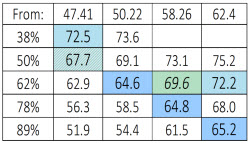
HOT’s been down for four months running, having lost about 14 percent of its value. The first major downside target is $73.0. If that breaks, a freefall to $65 could ensue, but $70, or $67.5 form interim support. These prices are reflected in the retracement tables shown below

Big Hotel Small Chart
Retracements from Lows to $87.99


Since Friday, there’s been a small correction, but HOT declined today, August 11. $78 could be tested, and a close over next resistance at $81 would call for a recovery.

Starwood (HOT) Technical Indicators

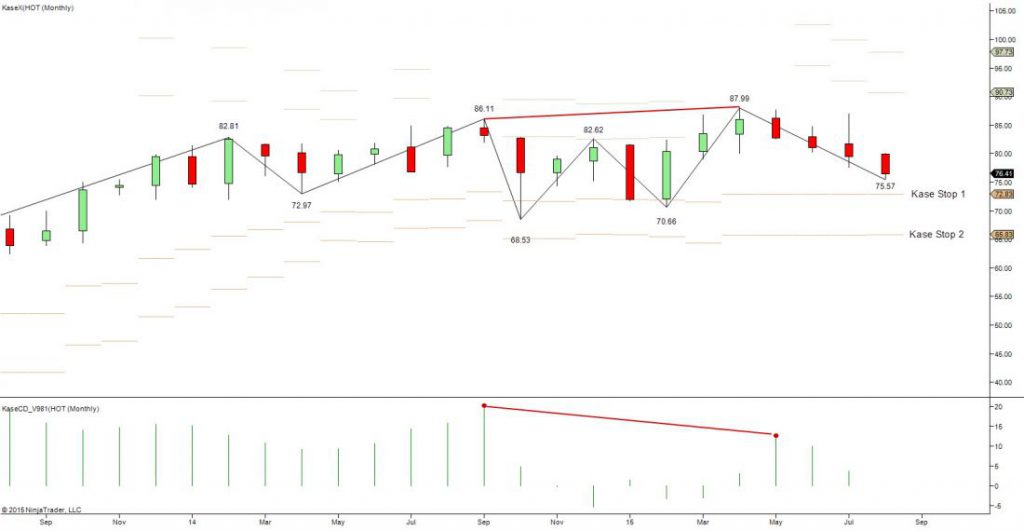
Looking at the technicals, Starwood’s monthly chart generated a negative divergence back in April based on the KaseCD. Four down months have followed, but lows have not yet reached Kase’s first stop level at $72.83. The stop is near a key target, centered on $73.Big Hotel Chart

The first wave of a pattern is always the most important. Here that’s 87.99 – 79.53 – 86.96, the 1.62 extension for which is $73. If the pattern extends, look for $65, the trend terminus. This is just above Kase’s second stop at $65.8. The most recent wave is 87.99 – 79.53 – 86.96, and $73 is its equal extension as well as the Phi-squared corrective projection.

Backtracking, July 31 was an aberrant, outside, down day. Prices spiked to $86.96 only make a $77.72 low. $73 and $65 are targeted by this day’s waves.

The last four days through Tuesday for a Harami line with stars. The daily chart is oversold, but not divergent. Prices rose about $1.50 from $75.57, but fell today. The wave up targets $78, which is its equal extension, as well as its Phi corrective projection. The wave also targets $81, using three different calculations. This is the “drop dead” price above which the tone becomes positive, and the highest price to which the small wave projects. These two resistance values are the midpoints for the August (so far) and July monthly candlesticks.

Recommended Starwood (HOT) Trading

If I were short above $86, I’d just stay short, perhaps scaling out at $78 and then $81, and exercising caution at the downside targets. Bearish intraday traders might time in here, but watch $73, and use tighter stops. Technically there is little room for optimism, but if you’re long on fundamentals, then monitor the downside targets. Above $81 – you’re “hot”.

Connect with me on LinkedIn for more Market Updates.

hogsby Cynthia A. Kase

Read on TraderPlanet.com

After last year’s viral outbreak that killed millions of hogs, pork production, now having recovered, looks to set records and overshoot demand. Apparently some commodity advisors are panicking and recommending that their producer clients use lean hog futures to hedge and avoid even lower prices. Is this a good idea?

To our view, hedging hogs today would be like closing the sty door after the pig has fled. In Kase’s energy practice, producers hedge when markets are enjoying high prices, not when already painfully low. At this point, defensive measures are called for.

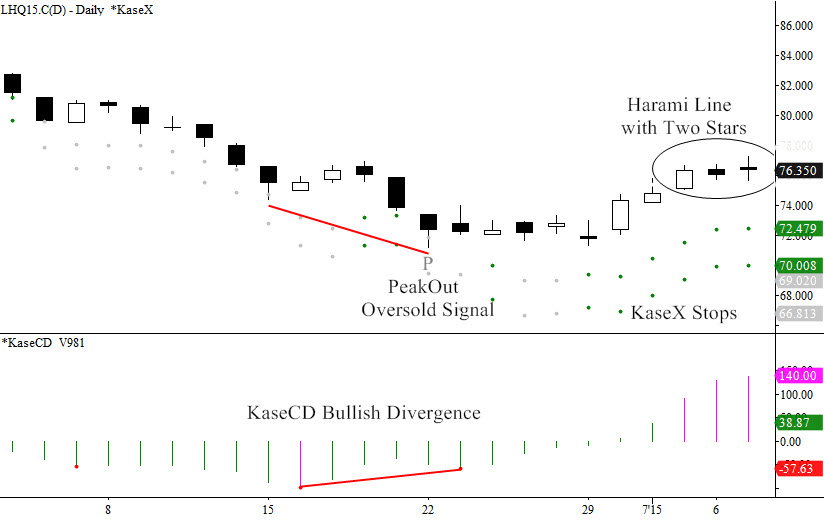
The reason I’d be a reluctant outright seller or short hedger is that prices have been rising over the past few weeks, not falling. Looking at the August 2015 contract, prices fell from a 95.35 high last November to a 71.175 low June 22. Then the KasePO and KaseCD momentum indicators generated bullish oversold and momentum divergence signals. A 71.275 swing low followed, forming a classic “W” shape, or double bottom.

lean hogs

Last week’s candlestick completed a classic bullish morning star. However, the pattern remains unconfirmed until a close over 76.65, dampening the bullish tone. Also, the daily chart shows a potentially negative Harami line with two stars.

While the overall structure is down, the current 6 cent bounce could continue to 79 and maybe 81.5. A close over 81.5 hasn’t high odds right now, but if it happens we could see another 10 cents. 79 is the 2*1.38 extension and Phi2 corrective projection for 71.175 – 74.05 – 71.275. For the final wave up spanning from July 2 to July 7, 75.175 – 77.275 – 75.625, 79 is the 1.62 extension and 81.5 is both the trend terminus (77.2753/75.1752), and 2*1.38 extension.

If there isn’t a close over 76.65 soon, the rally might fail. A close below June 2s open, 75.15, followed by 72.4 would be cause for concern. A close below 70 could send lean hog prices squealing – potentially to 55 cents as, from a technical standpoint, targets ranging from 67 down to 55 have similar odds.

72.4 and 70 are KaseX stops. The key wave, 95.35 – 86.00 – 90.65, targets 70 as the important 1.62 extension. The last down wave, 77.275 – 75.625 – 76.625 targets 72.4 as the trend terminus (77.2753/75.6252), 2*1.38 extension and Phi3 corrective projection.

Here’s my hedging strategy. If you’re ok with “getting called”, sell calls above the market, maybe just above 81.5, perhaps purchasing puts on the downside with the funds depending on your risk appetite and whether you need to qualify for hedge accounting. Otherwise wait for a drop below 75.15 or so, then scale-in short calls maybe five cents or so above the market, again possibly buying puts. Meanwhile, grab a beer and a brat and watch the thresholds.

Send questions for next week to askkase@kaseco.com, and for energy hedging visit the Kase Energy Hedging Services page.

Charts created using TradeStation. ©TradeStation Technologies, Inc. 2001-2015. All rights reserved. No investment or trading advice, recommendation or opinions are being given or intended.

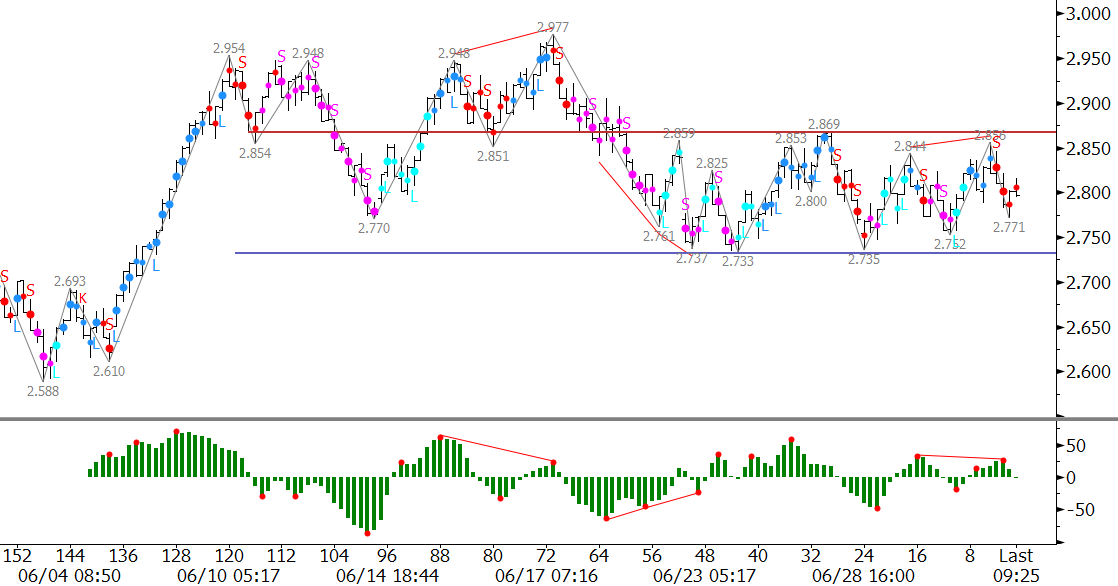
Markets are rarely more balanced that what we have experienced for natural gas over the past few weeks. After August failed to overcome $2.95 it stalled at $2.73, and is now in a mini-range between $2.73 and $2.87. Considering this week marked the end of the month and quarter, and is shortened due to the 4th of July holiday, a breakout will likely be delayed until next week.

The market is waiting for factors like summer weather and/or supply/demand issues to give us a breaking. The longer it delays the move up though, the more prices will erode away until it is too late to make a meaningful push higher.

It is still a bit early for the market to give up on a summer rally, but based on many technical factors we favor a break lower out of the mini-range between $2.73 and $2.87. This morning’s failed attempt to overcome $2.87, bearish KaseCD divergence and first short signal confirm our call. This would open the way for a confluent $2.64 target.

natural gas prices

Should prices close over $2.87 look for another test of $2.95, which is the key threshold for a push to levels above $3.00 and a summer rally.

This is a brief natural gas forecast ahead of tomorrow’s EIA report. Our weekly Natural Gas Commentary is a much more detailed and thorough analysis. If you are interested, please sign up for a complimentary four week trial.

Natural gas has finally showed some signs of life over the past few days in anticipation of tomorrow’s U.S. Energy Information Administration (EIA) Natural Gas Weekly Update. The short-term charts are showing that traders are anticipating a bullish EIA report, which would be the support the market needs to continue this upward correction. Keep in mind though, this is a correction, and it will likely be predominant in the winter month contracts and short-lived without continued support from external factors.

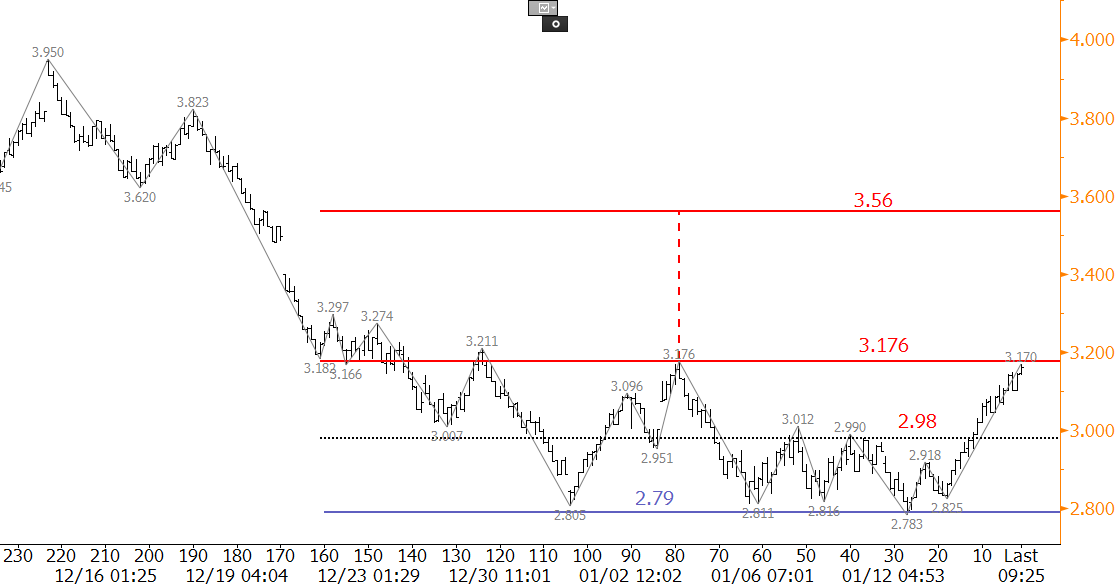
After oscillating in a sideways range between approximately $2.79 and $3.00 for the past six trading sessions, the February futures contract rose above $3.00 on Wednesday. This is near the $3.176 to $2.783 midpoint of $2.98, which is significant because this is also in line with the 0.618 projection of the irregular wave $2.803 – 3.176 – 2.783. The $1.00 projection of this wave was overcome at $3.15, and the 1.618 projections is $3.38. The $3.38 level is important because it is the 50 percent retracement from $3.95 to $2.783. This level will likely be met, and possibly overcome, upon a bullish EIA number tomorrow.

NGG

In addition, February overcame the crucial $3.176 swing high, and a sustained close over this would confirm the recent bottoming formation (arguably a triple or even quadruple bottom). The projection for this formation is $3.56.

Near-term support is $3.04 and then $2.94. These are the 38 percent and 62 percent retracements of the move up from $2.783 to $3.204 (swing high as of this analysis). These levels are also near the midpoint and open of today’s candlestick. A close back below $3.04 would call into question the validity of the move up. A close below $2.94 would negate the near-term positive tone altogether, and open the way for a continued decline.

The long-term outlook for natural gas is bearish, but the move up over the past two days has shifted the near-term outlook to positive. A close over the $3.176 swing high today will open the way for an extended correction to $3.38 and possibly higher tomorrow.

For more information about Kase’s weekly energy forecasts on natural gas and crude oil please visit our energy forecast page.

Dean Rogers
Senior Analyst
Kase and Company, Inc.

The outlook for natural gas is negative, and without help from external factors the decline will likely continue. However, the market is hesitant to break support at $2.80 in the near-term, and is likely waiting on tomorrow’s U.S. Energy Information Administration (EIA) Natural Gas Weekly Update before it presses higher or continues to decline.

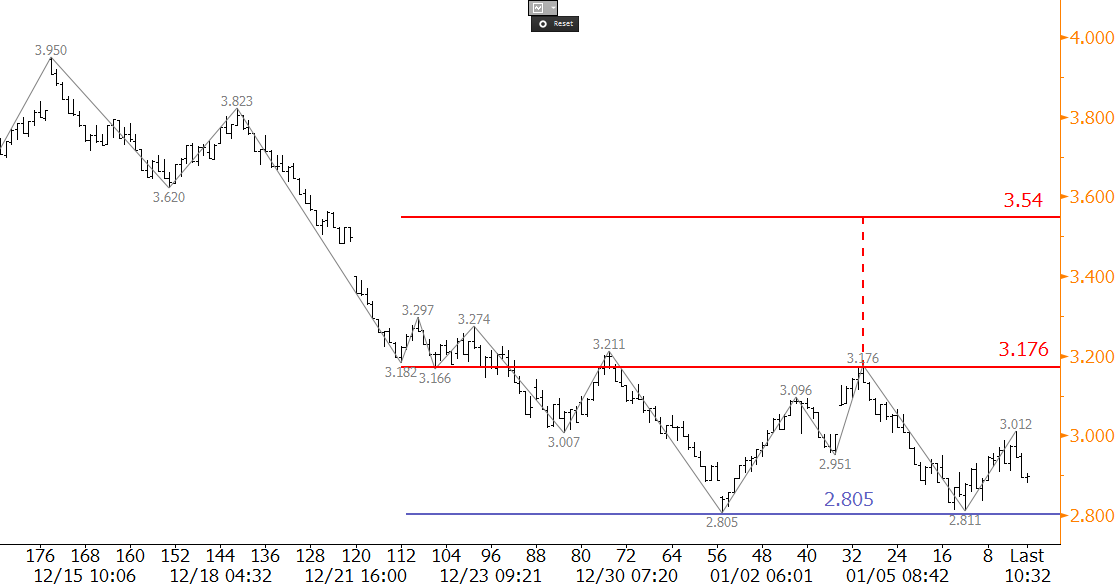
Several positive technical factors indicate resistance will likely be tested before tomorrow’s EIA report. A small intraday double bottom formed at $2.805, as shown on the 120-minute equivalent Kase Bar chart. The confirmation point for the double bottom is $3.176, which is in line with the 1.00 projection for the wave $2.805 – 3.176 – 2.811. Immediate resistance is $3.04, the 0.618 projection. A move above $3.04 would call for $3.176 to be challenged, and a close over $3.176 would confirm the double bottom. This would then open the way for an extended correction to targets between $3.18 and the double bottom’s $3.54 target (calculation is 3.176 + (3.176 – 2.805) = 3.537). A move of this magnitude will not likely take place without major support from bullish external factors.

NGG

Should $3.176 hold, the move down will likely extend. First support is $2.89, and a close below this would call for a key target at $2.79. This is the 0.618 projection for the wave $3.176 – 2.811 – 3.012. A close below $2.79 would negate the double bottom and open the way for targets in the mid $2s.

Overall, the outlook is negative, and the move down is still favored. However, the double bottom, a daily morning star setup, and deeply oversold conditions, all indicate that a correction may take place very soon, and could be spurred by tomorrow’s EIA report.

Visit the Kase Energy Forecasts Page to sign up for a free trial of Kase’s weekly energy forecasts on natural gas and crude oil.