For the past few weeks, WTI crude oil has been trading in a tight range as it tries to sort through recent events and fundamental factors. Reports indicate Monday’s close at a 10-month high was due to concerns over continued supply disruptions and speculation that the Federal Reserve will not raise interest rates this month.
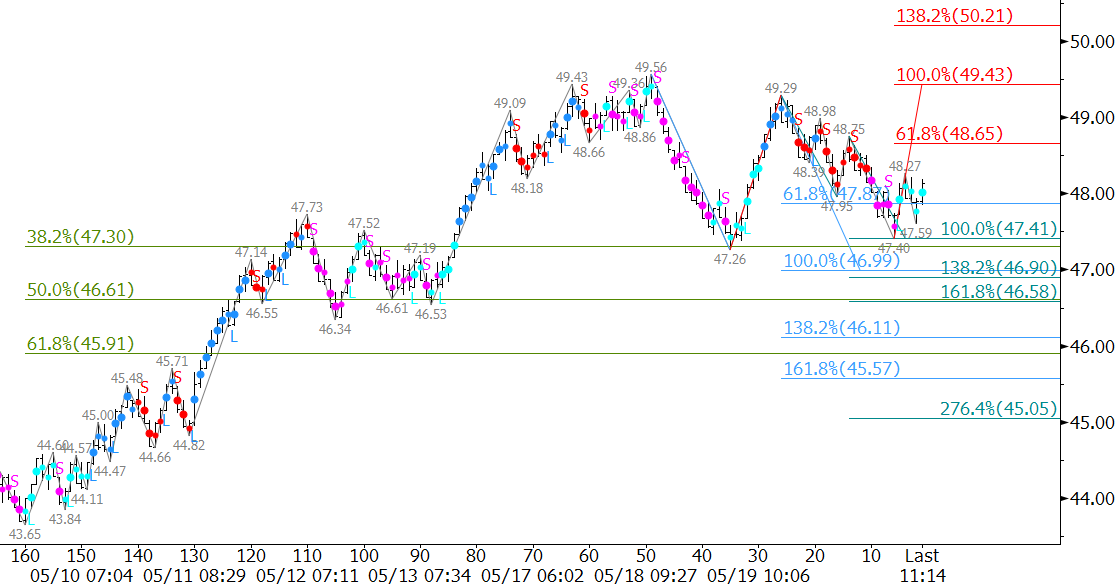
From a technical perspective, the recent wave formations show that prices are poised to rise to targets above $50.0 over the next few days before reaching the next major decision point in the mid-$50s. July WTI closed above the 0.618 projection of the wave up from $47.26 on Monday. Waves that overcome the 0.618 projection typically extend to at least the 1.00 projection, in this case $50.7. Therefore, odds favor a test of $50.7. A close over $50.7 would call for $51.8 and possibly higher this week.
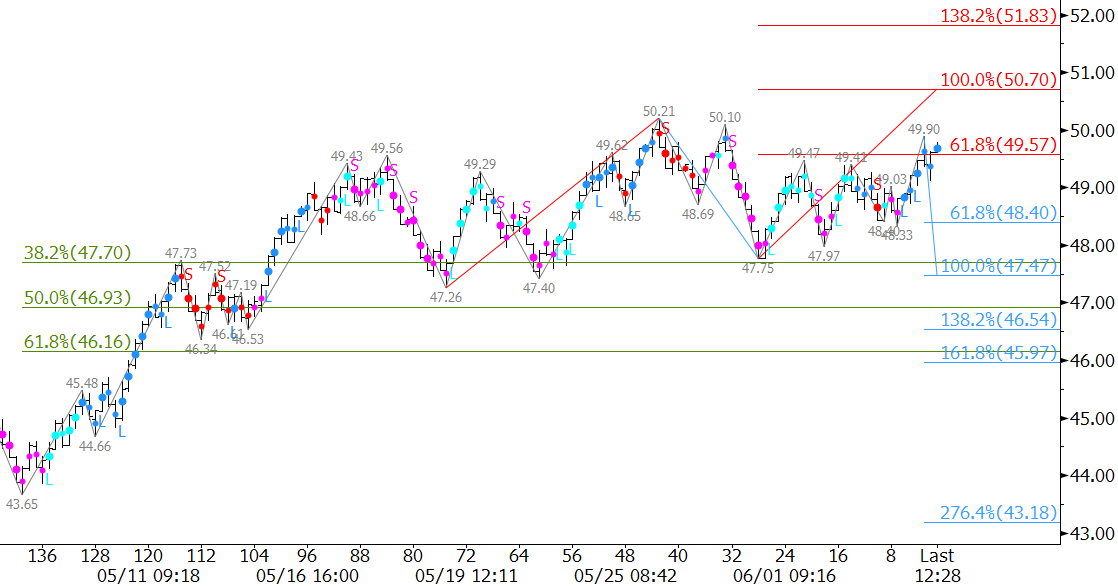
Support at $48.4 should hold. This is the 0.618 projection of the wave down from $50.21. It is also near the 62 percent retracement of the move up from $47.75 to $49.9. A close below $48.4 would call for a test of $47.5, which is near the bottom of the recent trading range. A close below this would open the way for an extended correction to $46.2 and possibly lower.
This is a brief analysis and outlook for the next day or so. Our weekly Crude Oil Commentary is a much more detailed and thorough energy price forecast. If you are interested in learning more, please sign up for a complimentary four-week trial.