Natural gas continues to send mixed signals on a day-to-day basis. However, that is pretty typical for this time of year during the shoulder months ahead of summer. Natural gas is trying to gauge the prospects of a recovery or a continued decline over the course of the longer-term, but it needs to gather more information first. With all current factors considered, it is looking like natural gas is settling into another trading range, though the boundaries of the range are still being determined.
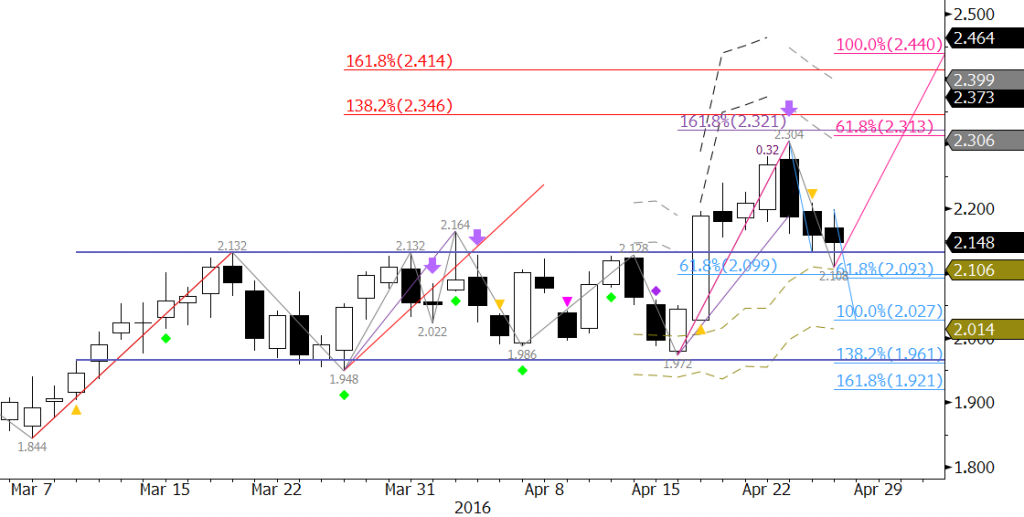
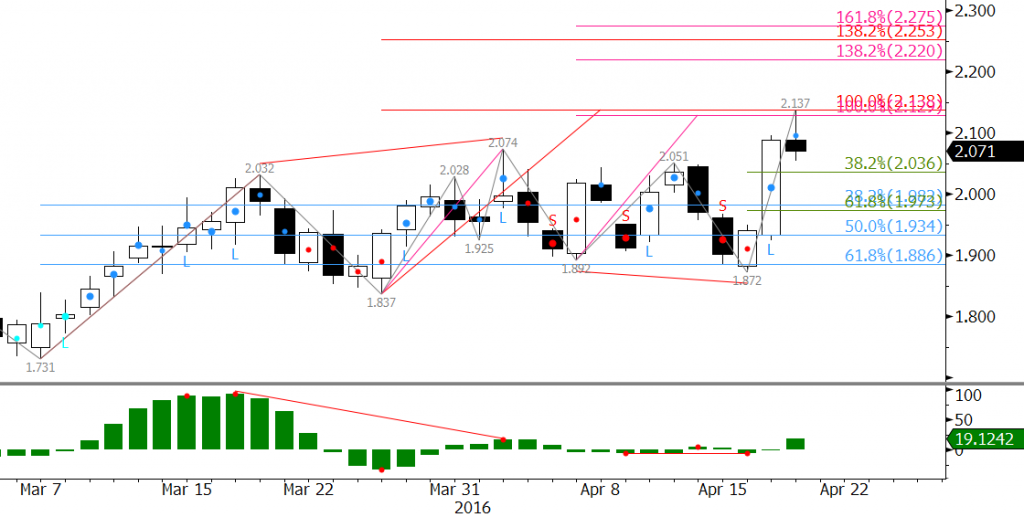
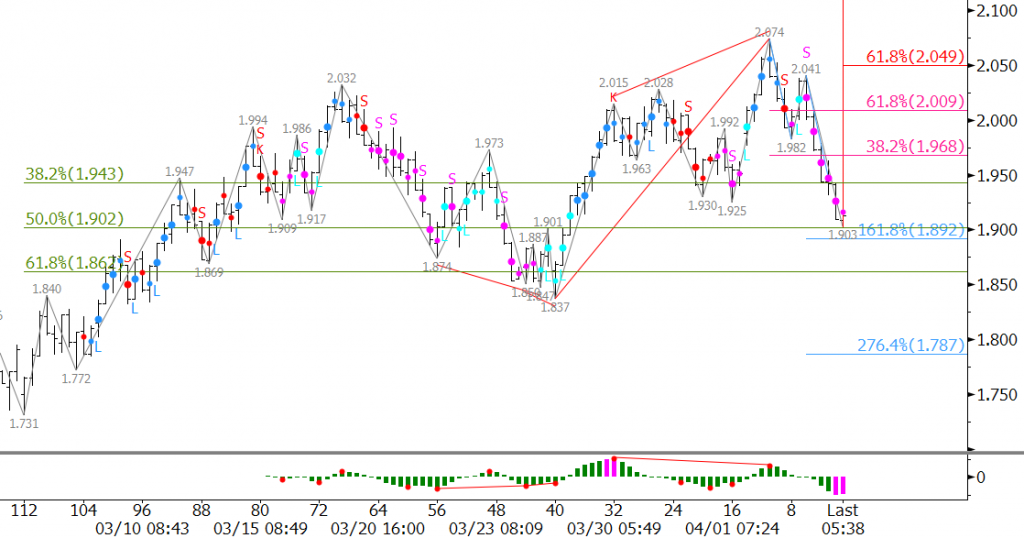
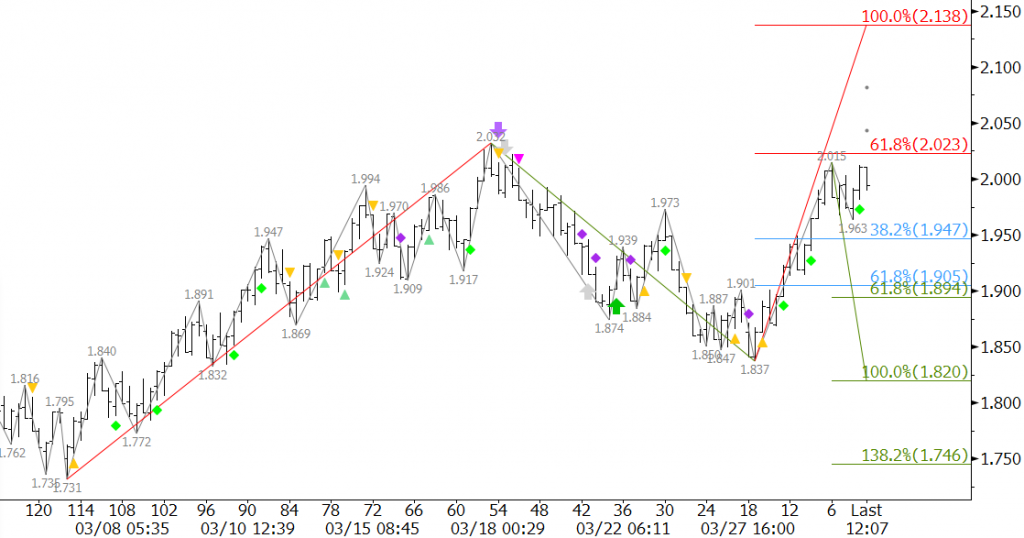
For now, odds still favor a decline. June natural gas met the 0.618 projection for the wave $2.304 – 2.042 – 2.195 at $2.026 on Monday. Waves that meet the 0.618 projection typically extend to the 1.00 projection, in this case $1.93. Therefore, unless $2.195 is overcome, odds ultimately favor $1.93.
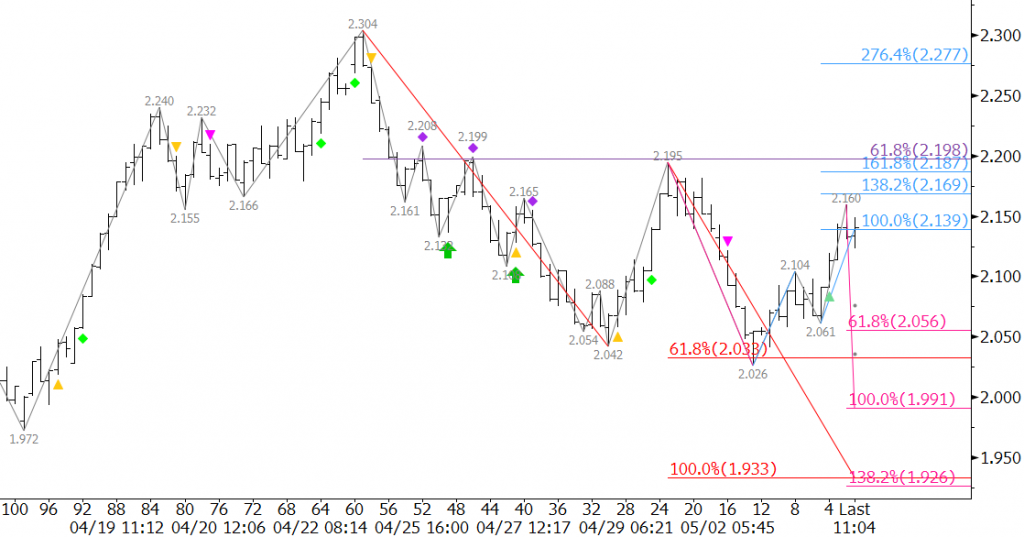
That said, the wave up from $2.026, aided by today’s close over $2.14, shows potential to extend to its 1.618 projection of $2.19. This is near the $2.195 swing high and the 62 percent retracement of the decline from $2.304 to $2.026. A move above $2.195 would take out the wave down from $2.304 that projects to $1.93 and lower, and in turn, shift odds in favor of $2.28 and higher.
First support is $2.06, the 0.618 projection of the wave $2.195 – 2.026 – 2.16. A close below this would take out the wave up from $2.026 and the near-term potential of overcoming $2.195. This would also open the way for another attempt at $2.00 and lower.
The key over the next few days will be either a move above $2.195 or below $2.061. As stated, odds favor the decline, but it is a very tight call right now.
This is a brief natural gas forecast for the next day or so. Our weekly Natural Gas Commentary is a much more detailed and thorough analysis. If you are interested in learning more, please sign up for a complimentary four-week trial.