Gold Technical Analysis and Near-Term Outlook
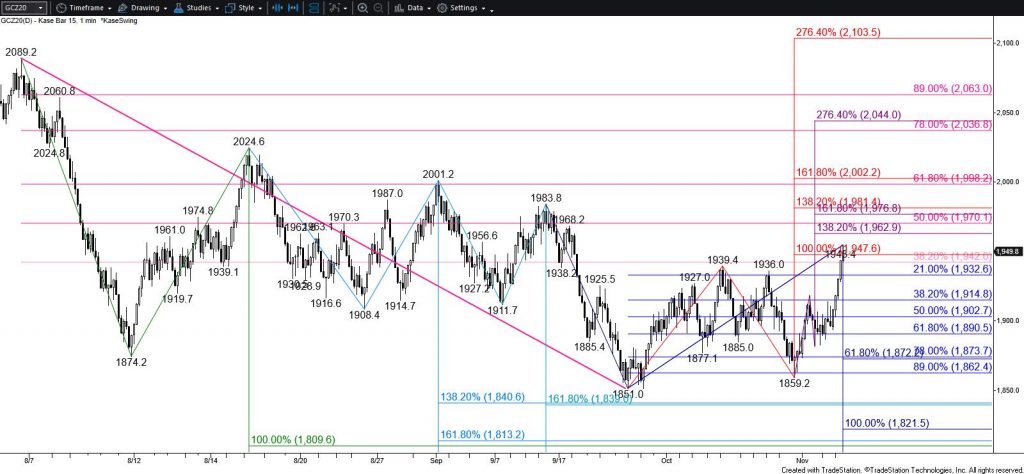
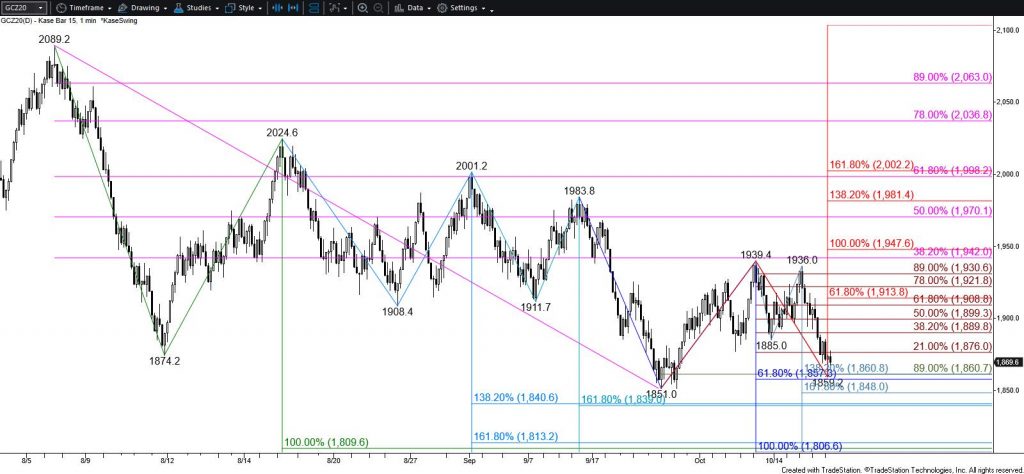
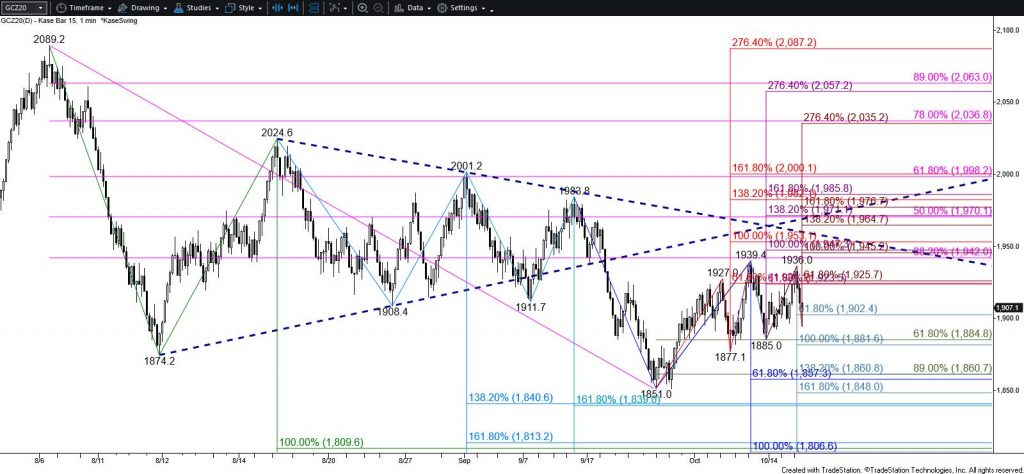
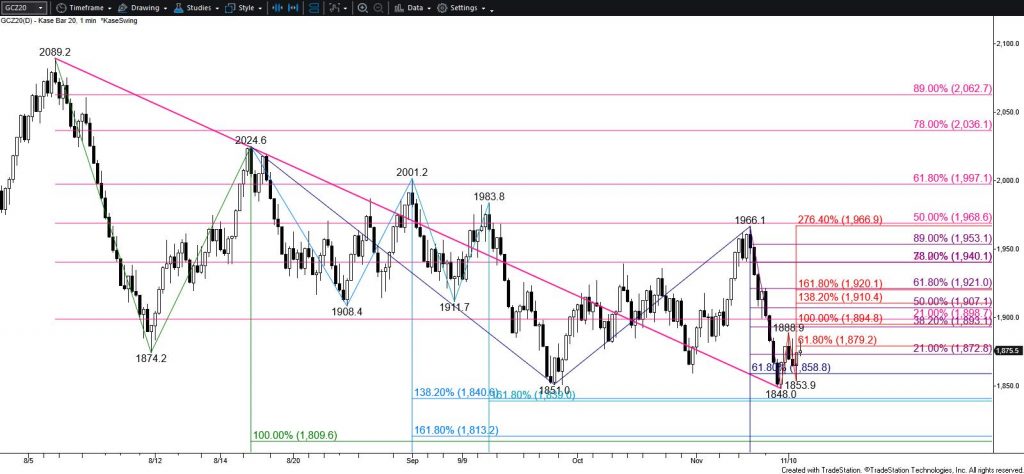
The outlook for gold is bearish and the move down is still in a position to eventually reach $1814. This is the equal to (1.00) target of the primary wave down from $2089.2. The connection to $1814 is made through $1854 and $1841.
Nevertheless, today’s $1883.0 high fulfilled the smaller than (0.618) target of the wave up from $1848.0. Therefore, there is a reasonable chance for gold to reach the $1895 equal to (1.00) target before the decline continues. This is also in line with the 38 percent retracement of the decline from $1966.1 and the 21 percent retracement of the decline from $2089.2. For the move down to continue during the next few days $1895 must hold. Closing above this will call for a test of key near-term resistance at $1921. Settling above $1921 would reflect a bullish shift in near-term sentiment and call for another substantial test of resistance before the decline continues.
This is a brief analysis for the next day or so. Our weekly Metals Commentary and daily updates are much more detailed and thorough energy price forecasts that cover key COMEX precious metals futures contracts and LME Non-Ferrous (Base) metals, spot gold, the gold/silver ration, and gold ETFs. If you are interested in learning more, please sign up for a complimentary four-week trial.