Natural Gas Technical Analysis and Near-Term Outlook
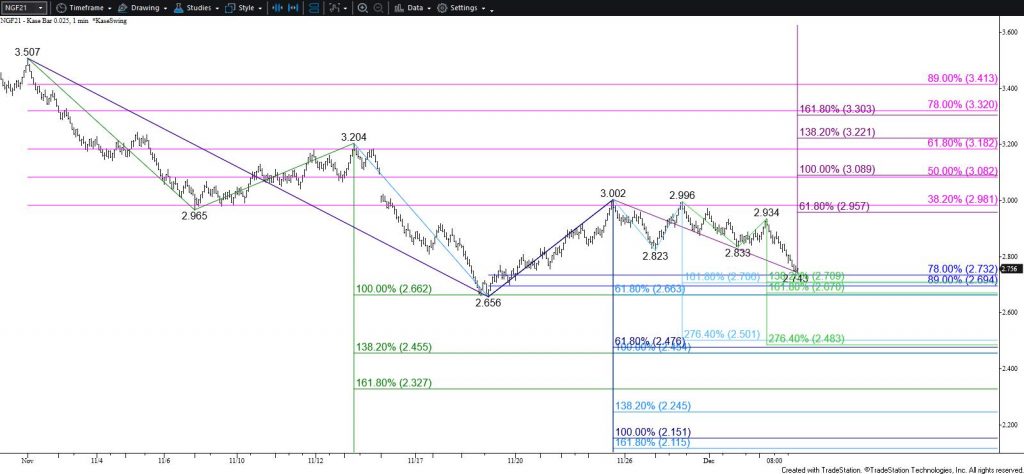
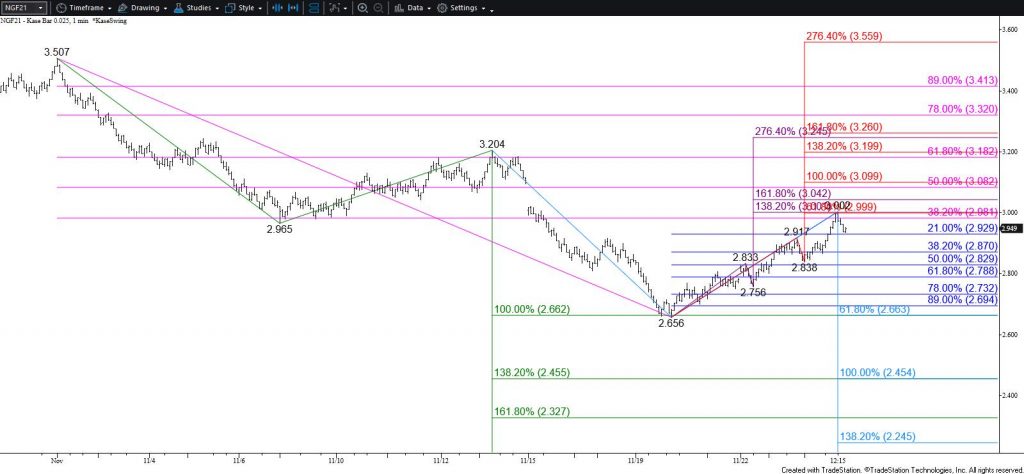
The outlook for natural gas remains bearish due to the sustained close below $2.48. This was a highly confluent and crucial wave projection for the January contract and the continuation chart that connects to $2.15 as the next major objective. Near-term odds favor a continued decline and a close below $2.37 will clear the way for $2.33 and likely lower during the next couple of days.
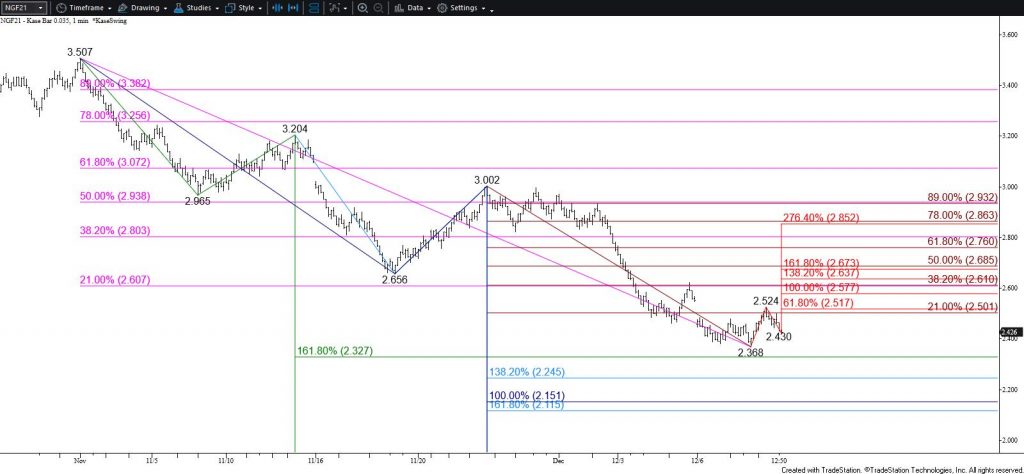
With that said, Monday’s potential intra-day exhaustion gap, today’s inverted hammer, and confirmed weak bullish KasePO, KaseCD, and MACD divergences suggest a bottom might be forming. These signals do not exude a bullish shift in sentiment, but a move above $2.52, the smaller than (0.618) target of the wave up from $2.368, will call for a test of $2.58. Rising to $2.58 would overcome Monday’s gap down and confirm that this was most likely an exhaustion pattern. A close above $2.58 would call for a larger test of resistance with the next thresholds at $2.67 and $2.76.
This is a brief analysis for the next day or so. Our weekly Natural Gas Commentary and daily updates are much more detailed and thorough energy price forecasts that cover key natural gas futures contracts, calendar spreads, the UNG ETF, and several electricity contracts. If you are interested in learning more, please sign up for a complimentary four-week trial.