Natural Gas Technical Analysis and Near-Term Outlook
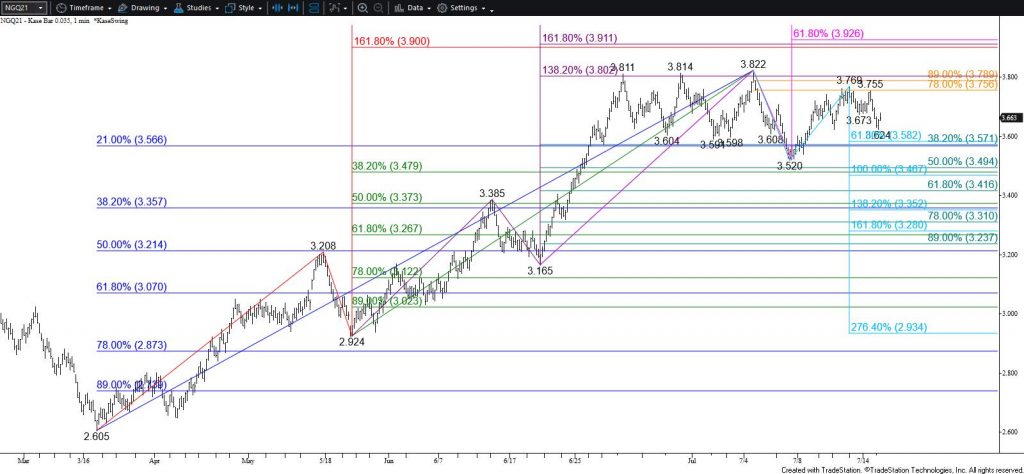
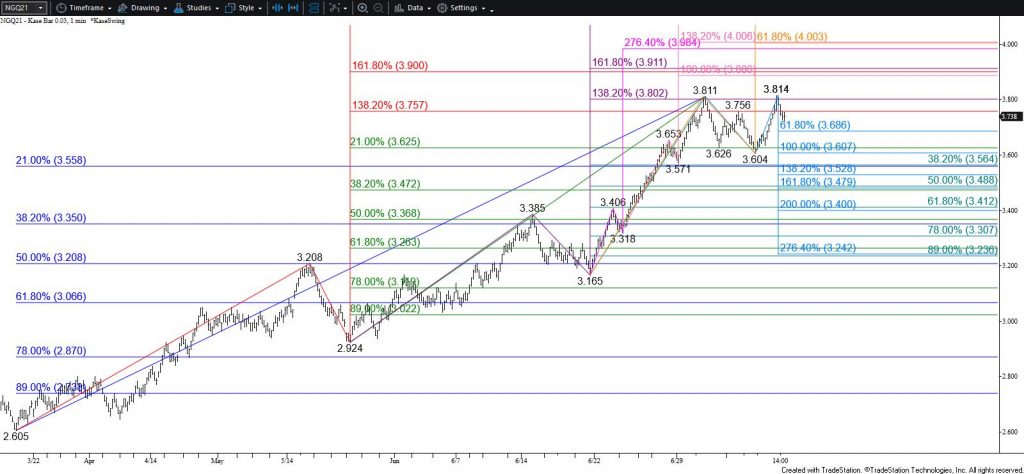
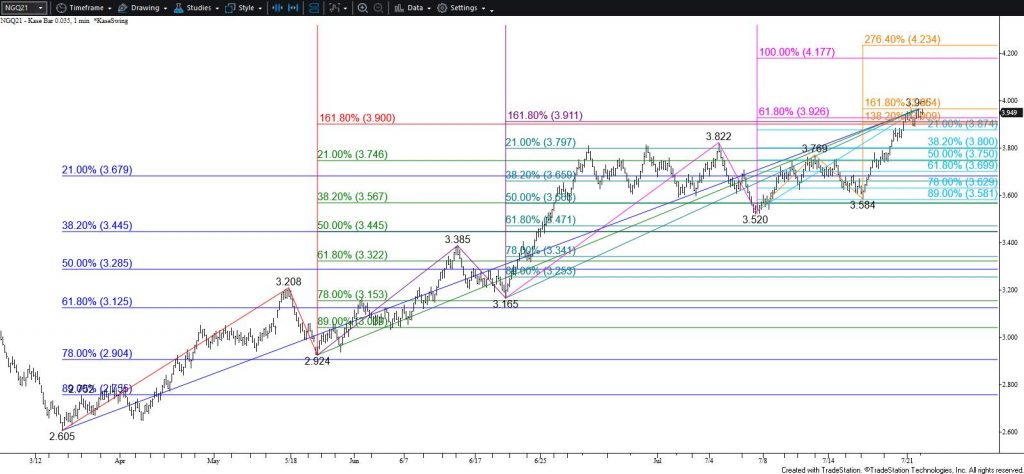
Natural gas rose as called for in yesterday’s update and easily pushed through the crucial $3.91 objective as suspected. Closing above $3.91 positions natural gas to challenge $4.00 and possibly higher during the next few days.
With that said, the move up became somewhat hesitant after overcoming $3.91. The move up is also due for a pullback because the larger than (1.618) target of the wave up from $3.52 held. Therefore, a test of $3.87 might take place before rising to challenge $4.00. For now, $3.87 is expected to hold and $3.80 is key support for the near-term outlook. Settling below $3.80 would shift near-term odds in favor of $3.74 and possibly $3.69.
This is a brief analysis for the next day or so. Our weekly Natural Gas Commentary and daily updates are much more detailed and thorough energy price forecasts that cover key natural gas futures contracts, calendar spreads, the UNG ETF, and several electricity contracts. If you are interested in learning more, please sign up for a complimentary four-week trial.