WTI Crude Oil Technical Analysis and Short-Term Forecast
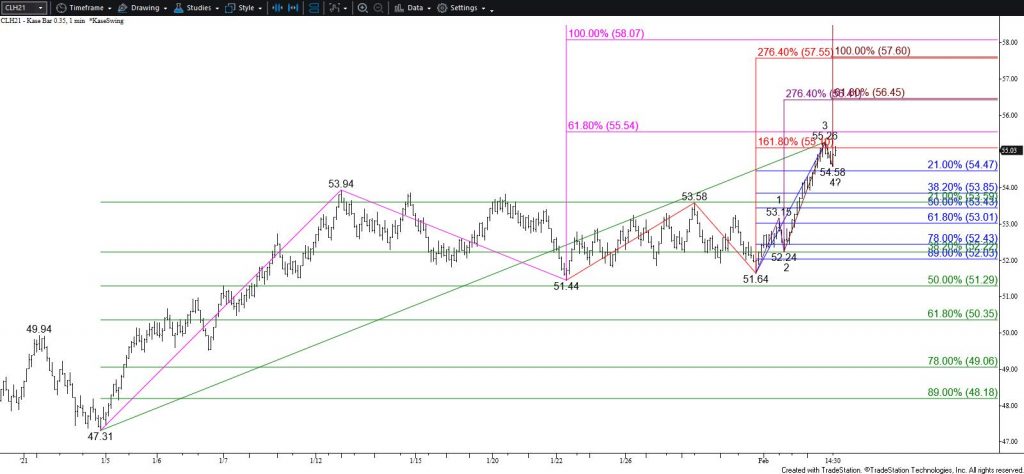
WTI crude oil rose as expected today and challenged the $58.5 target discussed in Monday’s analysis. The move up is now poised to reach a crucial bullish decision point at $59.1. This is the intermediate (1.382) target of the March contract’s primary wave up from $27.66 and the equal to (1.00) target of the largest subwave up from $46.3. Overbought weekly and daily momentum oscillators, bearish divergence setups, and today’s hanging man all warn that the move up is nearing exhaustion. Therefore, $59.1 is a probable stalling point. However, settling above $59.1 for a few days will clear the way for a test of $60.0 and eventually a push toward the uptrend’s next major objective at $63.2. The $63.2 objective is the larger than (1.618) target of the wave up from $27.66.
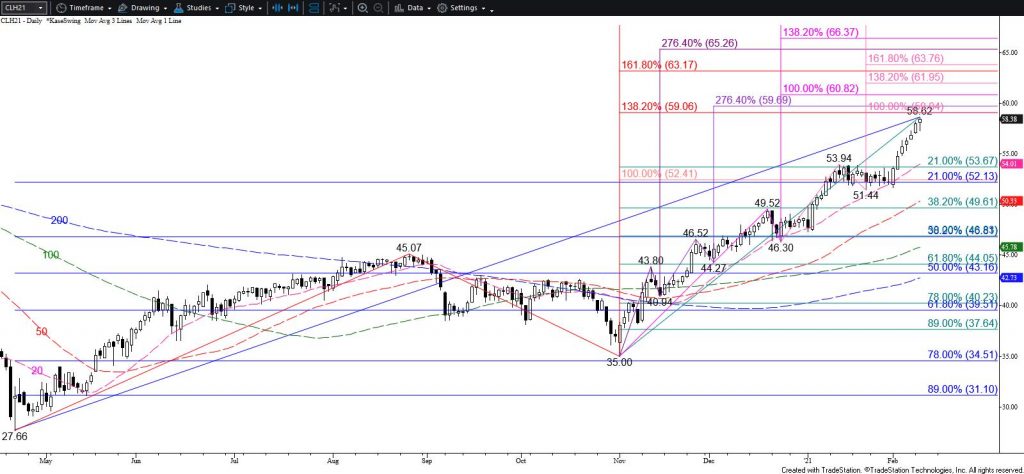
As mentioned, today’s hanging man and the weekly and daily momentum oscillators warn that the move up will probably stall soon. The most probable stalling point is $59.1. However, as of this afternoon, there are no confirmed bearish patterns or signals that call for a significant test of support before reaching $59.1. Initial support at $57.7 is expected to hold tomorrow and $57.1 is key. Settling below $57.1 will confirm today’s hanging man and clear the way for a test of $56.0 and possibly lower before the uptrend fulfills the $59.1 objective.
This is a brief analysis for the next day or so. Our weekly Crude Oil Forecast and daily updates are much more detailed and thorough energy price forecasts that cover WTI, Brent, RBOB Gasoline, Diesel, and spreads. If you are interested in learning more, please sign up for a complimentary four-week trial