Spot Gold (XAU)
The long-term outlook for gold is still reasonably promising after prices rallied from a six-year low in December. However, from a technical standpoint, the decline from the 1263.48 swing high is poised to challenge support targets before the move up continues.
KaseX triggered a strong short entry signal called a pierced dart (gray down arrow and yellow triangle) on February 15. On that same day a bearish Harami line and star was completed. The subsequent pullback to 1240.02 held the 1263.48 swing high and was followed by a confirming short signal on Monday, February 22. Monday’s decline also completed another bearish Harami line and star. These factors call for the decline to continue for the near-term.
Gold Daily Candlestick Chart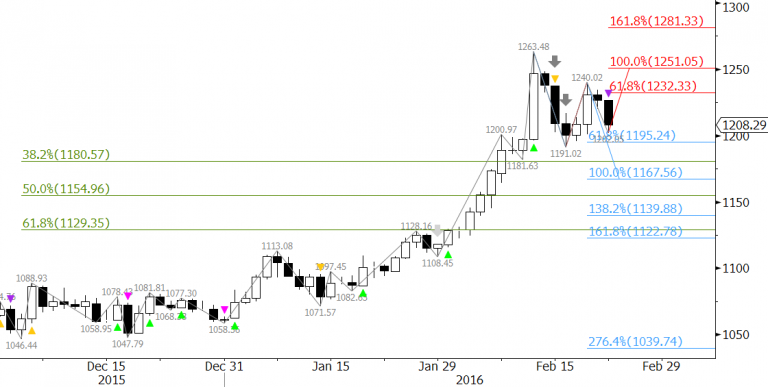
The primary wave that the move down formed, 1263.48 – 1191.02 – 1240.02, projects to 1194.5 as the 0.618 target. Most waves that meet the 0.618 projection extend to at least the 1.00 projection, which in this case is near the 1163.6 confluence point. 1163.6 is the decision point for a larger correction to 1126.2 and possibly lower. A close below 1163.6 would significantly dampen the likelihood of a continued rise, and a close below 1126.2 would shift the long-term outlook to negative.

First resistance is 1232.3. This is currently the 0.618 projection of the small wave up from 1191.02. A close over this would call for 1251.1, the 1.00 projection. As it stands, odds are 25 percent for a close over 1251.1 before at least 1194.5 is met. A close over 1251.1 would indicate that the move up should extend to at least 1277.1 and possibly 1331.0 and higher.
S&P 500 Index (SPX)
The S&P 500’s rally from a double bottom at 1810.1 has been relatively strong and is challenging the completion point of the formation at 1947.2. This is significant because a close over 1947.2 would complete the double bottom and open the way for a potential rally to the formation’s 2084.0 target.
S&P 500 Index Daily Chart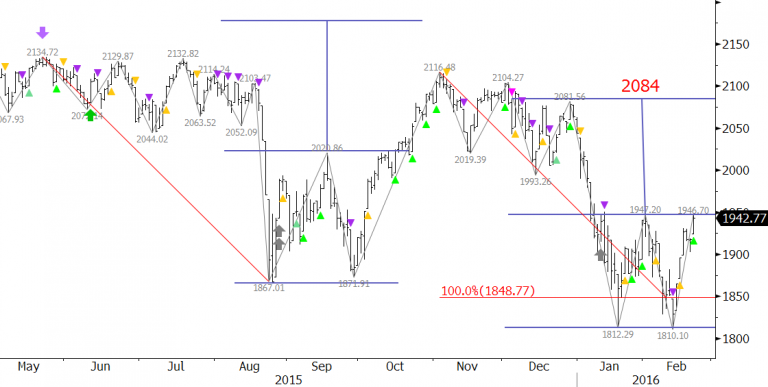
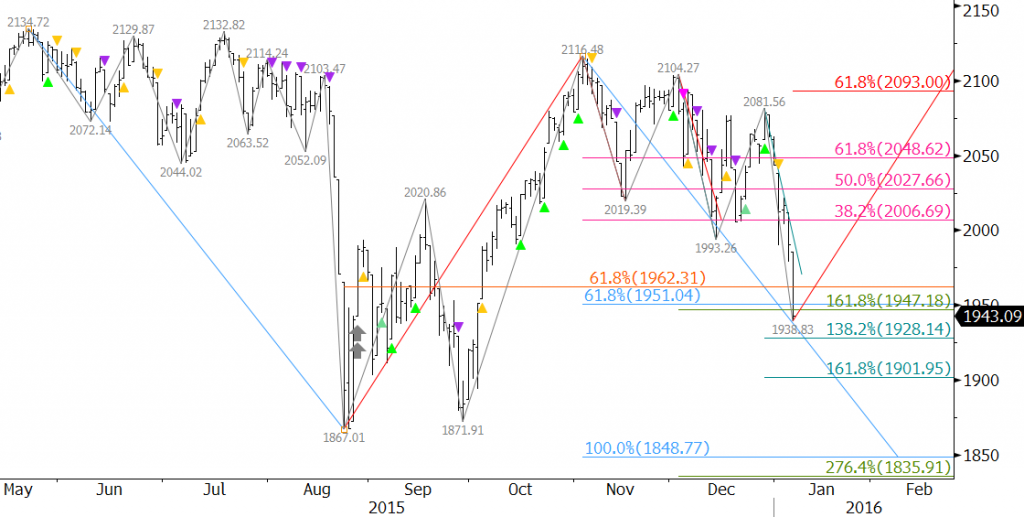
A similar double bottom had formed in late 2015 and was completed when the index closed over 2020.86. The ensuing move fell short of this double bottom’s 2177.0 target, but was still substantial. We could see a similar type of rally upon a close over 1947.2 that falls short of the 2084 target, but challenges key resistance before the decline continues.
Other technical factors, such as wave projections and retracements, call for at least 1971.6. This then connects to 2019.7, 2057.7, and finally 2084.

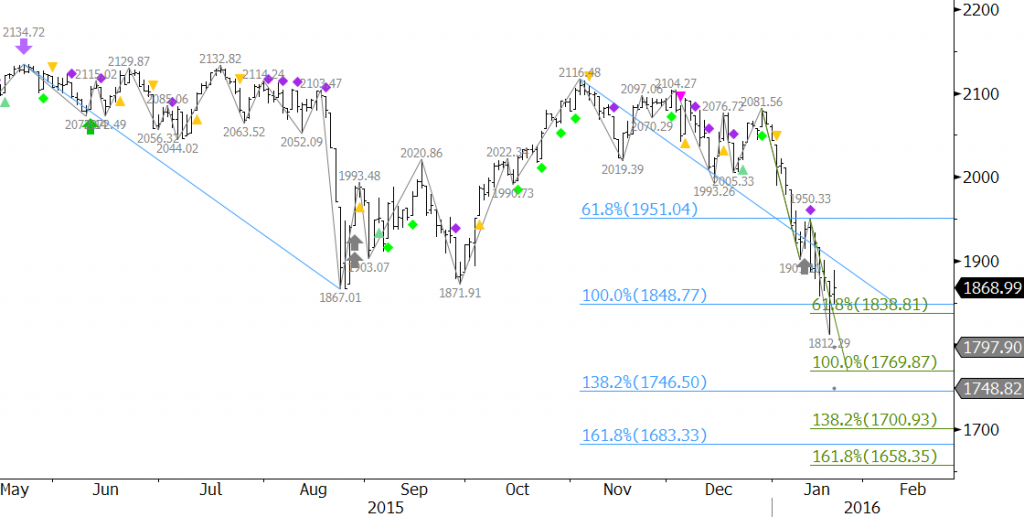
The move down stalled just below a key support level at 1849. This was the 1.00 projection of the wave 2134.72 – 1867.01 – 211.48. The index only closed for one day below this level, so this is still crucial support.
A normal correction of the move up should hold 1894.0 and must hold 1862. These are the 38 and 62 percent retracements from 1810.1 to 1946.7. Key support is 1848, and a close below this would shift the outlook back to negative and call for 1810 and lower again.
These are brief technical analyses with a 10-day outlook based upon Kase’s technical forecasting models and trading indicators KaseX and Kase StatWare. If you are interested in taking a trial of KaseX or Kase StatWare please contact sales@kaseco.com. We would love to get your thoughts about the forecasted targets and probabilities. Leave a comment or send them along with your request for a trial to sales@kaseco.com.







 by
by 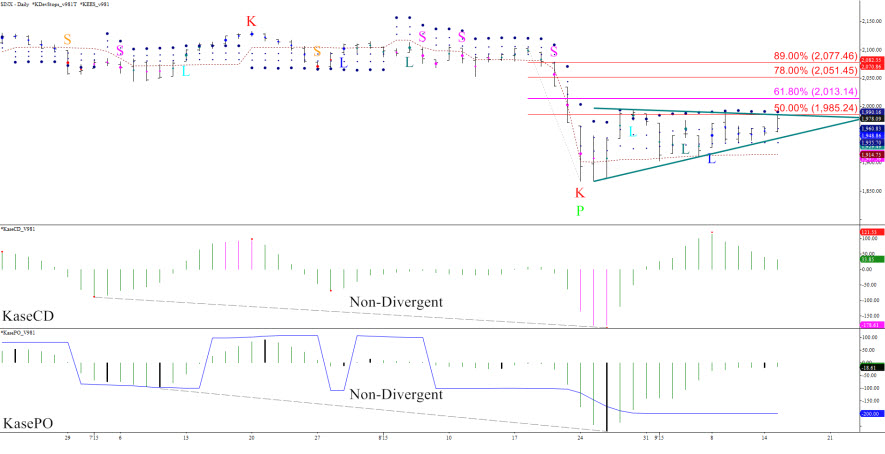 Charts created using TradeStation. ©TradeStation Technologies, Inc. 2001-2015. All rights reserved. No investment or trading advice, recommendation or opinions are being given or intended.