How is Technical Analysis Used?

Technical analysis is technical. This means there are mathematics, charts, and statistics involved. Some interested in studying and using technical analysis are dismayed when they encounter numbers and charts. A math, engineering, science, or financial degree is not required to make use of technical analysis. However, an orientation towards structuring a view of reality mathematically is helpful.

Some people think technical analysis is a way to quickly make a lot of money, become a hotshot trader, or a means to finding the “Holy Grail” of trading systems. Technical analysis is certainly a means to success, but there is no way to get around the need for commitment and perseverance. Success in using technical analysis, like any endeavor, will take hard work, commitment, and perseverance.

The Four Aspects of Technical Analysis

When using technical analysis there are four basic applications: instrument selection, timing trade entries and exits, managing risk, and forecasting.

Technical analysis can be used to select instruments to trade. For instance, if a trader wanted to scan the 1,000 most active stocks and pick the instrument most likely to take a sharp turn, they could use technical momentum indicators such as the MACD or RSI to look for divergence. Divergence is a momentum signal that is triggered when a trend is exhausted. If a divergence occurs, it is likely that the instrument is getting ready to turn in a statistically significant manner. The trader can then decide to further analyze and possibly trade that instrument.

Once a trader has selected an instrument they can use technical analysis to determine the instrument’s direction, strength and extent of potential trends, support and resistance levels, potential turning points, and risk.

Technical analysis is, as the name implies, a study or examination of the market. The analogy commonly used in technical forecasting is that it is similar to cartography or map drawing. In other words, you are drawing a map of how to get from point A to point B.

Once the map has been drawn and the forecast is complete a trader can use technical indicators, geometric formations, and other methods of analysis to determine entry and exit point for the market. This is called market timing, and is one of the greatest strengths of technical analysis.

Example of Using Technical Analysis

In the daily chart below as natural gas prices fell to new price swing lows the RSI momentum indicator was making higher lows. This was a clue that the decline was exhausted and that a significant turn higher was about to take place. A trader with a short position would possibly cover the positon once the divergence was confirmed (green trend lines).
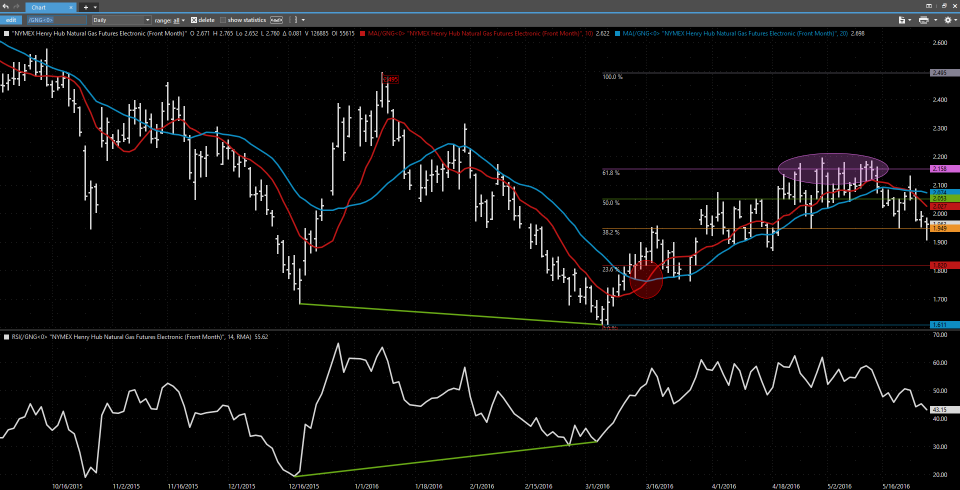
NG Daily RSI Divergence

After covering the short trade, the trader could then time a long entry when the 10-period moving average (red line) crossed above the 20-period moving average (blue line). This crossover is shown within the red circle. When the fast moving average (10-period) rises above the slow moving average (20-period) it suggests the move up should continue because there has been an upward shift in momentum.

Once the long trade has been taken, the trader can then begin to identify resistance levels using other methods of technical analysis. In the example above, a series of Fibonacci retracements from the $2.495 swing high to the $1.611 swing low are shown to the right of the chart. The 38.2, 50, and 61.8 percent retracement levels of this move were identified as resistance well ahead of being met. Note that at each of these levels a small turn lower or trading range took place. Ultimately, the move up held near the 61.8 percent retracement (pink ellipse) and turned lower again.

Conclusion

Technical analysis is a means of analyzing and interpreting what the market knows about itself. As discussed, the tools within the practice of technical analysis are useful for instrument selection, timing trade entries and exits, managing risk, and forecasting. By learning and using technical analysis, one can become a better trader by gaining a deeper level of insight into the markets they trade.

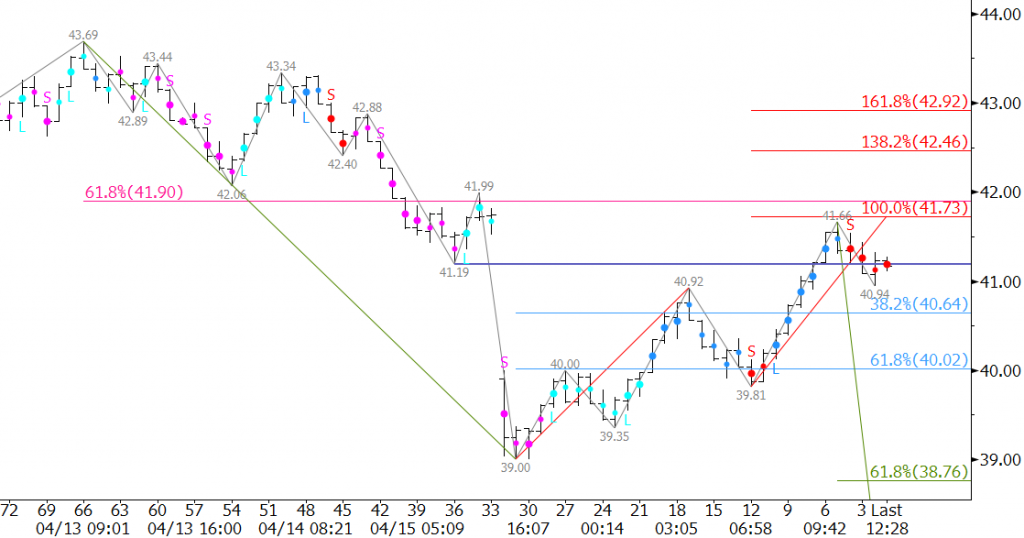
The failure to reach an agreement to freeze crude oil output levels for key producers caused prices to slide in early trading Monday. June WTI gapped down from Friday’s $41.19 low and met crucial support at $39.0. However, the labor strike in Kuwait, which has decreased the nation’s output by nearly 60 percent for the second straight day, lent support to the market. June WTI rose to $41.66 and settled at $41.19 on Monday.

The bounce to $41.66 filled the gap and fulfilled the 1.00 projection of the wave $39.0 – 40.92 – 39.81. The move up may gather some strength from the strike in Kuwait and extend a bit higher on Tuesday. However, from a technical standpoint, the move up from $39.0 was not unusual. Gaps are usually filled, and as stated, the move up from $39.0 has already met technical resistance near $41.66.

CLM6 20160418
crude oil

Without support from bullish fundamentals or further random events (such as the strike in Kuwait), we expect prices to grind their way lower to support at $40.6 and $40.0 over the next few days. $39.0 remains key, and a close below this would open the way for major support in the mid $30s.

That said, a close over $41.7 would call for $42.5 and possibly $42.9. At this point, we don’t expect to see prices rise above $42.9.

This is a brief analysis and outlook for the next day or so. Our weekly Crude Oil Commentary is a much more detailed and thorough energy price forecast. If you are interested in learning more, please sign up for a complimentary four-week trial.

Saudi Arabia once again made clear they will only freeze output at current levels if other nations, including Iran, also do so. Iran has balked at the idea and stated objections on numerous occasions. Reports indicate this came as a shock to bullish oil traders, some of whom had thought the Saudi’s softened their tone and have been more willing to discuss a deal.

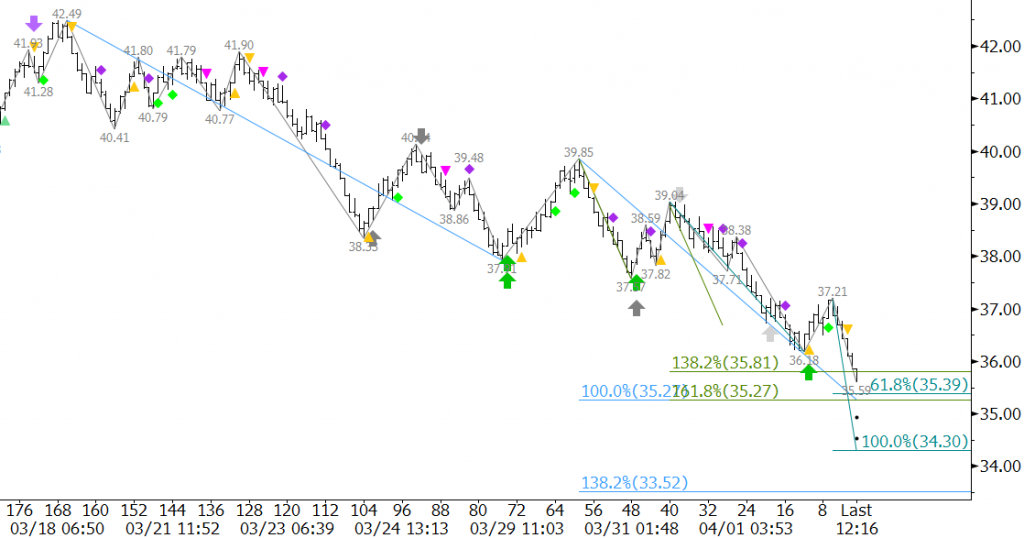
On Friday, May WTI futures finally closed below crucial support at $37.8. The move down extended on Monday and is quickly closing in on crucial support at $35.3. This is a confluent wave projection for the waves down from $42.49, $39.85, and $39.04. It is also near the 62 percent retracement of the move up from $30.67 to $42.49.

CLK6 20160404

The confluence of projections and retracements at $35.3 make it a potential stalling point. However, so far, the market has not shown reason to believe the recent decline will end. A close below $35.3 would open the way for $33.6 and lower where extremely important targets protecting the May contract low will be tested.

Prices will likely bounce soon, but that will not mean that the move down is over. Look for initial resistance at $36.6 and key near-term resistance at $38.2. We expect that for the time being there will be plenty of selling pressure upon retracements to these levels.

This is a brief analysis and outlook for the next day or so. Our weekly Crude Oil Commentary is a much more detailed and thorough energy price forecast. If you are interested in learning more, please sign up for a complimentary four-week trial.

S&P 500 Index (SPX)

By Dean Rogers

The slowing Chinese economy, lackluster manufacturing data, and a weaker yuan have sent Chinese stocks tumbling in the first week of 2016. China’s stock market has been halted twice this week when volatility limits were reached and is down seven percent over the last few days. The selloff has spilled over into global markets as the Dow Jones Industrial Average and S&P 500 Index are off to their worst starts for a year ever.

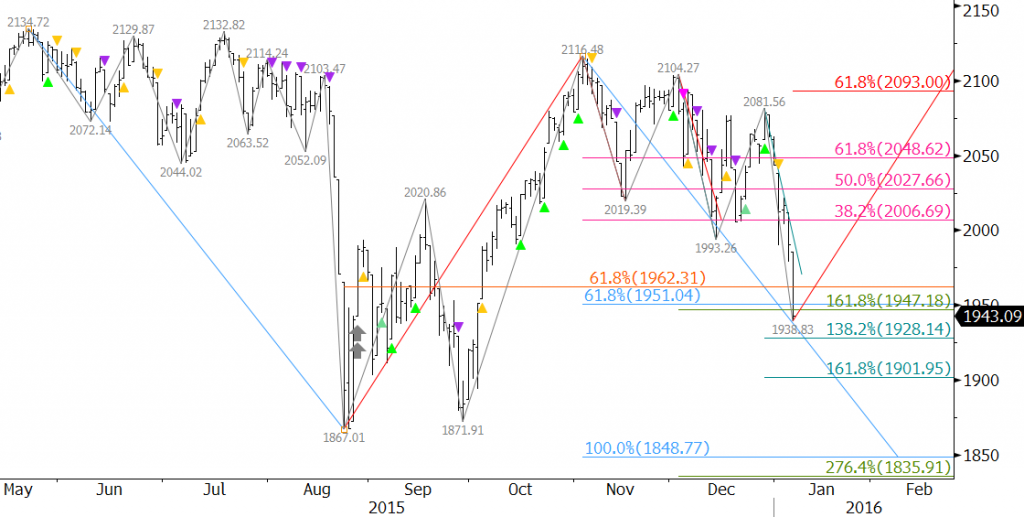
The S&P 500 Index (SPX) charts reflect the near-term negative tone. Several factors indicate the decline should challenge support levels below August’s 1867.01 low at 1842. This will be a crucial decision point for a much more bearish outlook and sustained decline over the next several weeks and possibly months.

The table below shows SPX targets and resistance levels and the associated probabilities for meeting those targets and levels within the next 10 trading days. Kase’s technical forecasting models indicate odds are 80 percent for at least 1900 and 65 percent for 1842. The latter is the bearish decision point and will probably hold, at least initially.

SPX-Table

January 7’s close below the 62 percent retracement of the move up from 1867.01 to 2116.48 has shifted odds in favor of a continued decline. In addition, the 0.618 projection of the primary wave 2134.72 – 1867.01 – 2116.48 has been taken out by January 7’s close. Waves that close below the 0.618 projection generally extend to at least the 1.00 projection, in this case 1842 (+/- 7 points). Therefore, the SPX should fall to 1842 before a significant upward correction takes place. A close below 1842 would call for 1744 as the 1.382 projection for the wave down from 2134.72 with an intermediate confluence point at 1788.

SPX Daily with KaseXSPX-Daily

First resistance is 2006, the 38 percent retracement of the decline from 2116.48 to 1938.83. This level will most likely hold upon a correction. The key level for the near term is 2048, the 62 percent retracement. A close over 2048 would indicate the move down is most likely over and that the SPX will push towards at least 2093 which connects to 2184. A close over 2048 has 35 percent odds and a close over 2093 has 20 percent odds.

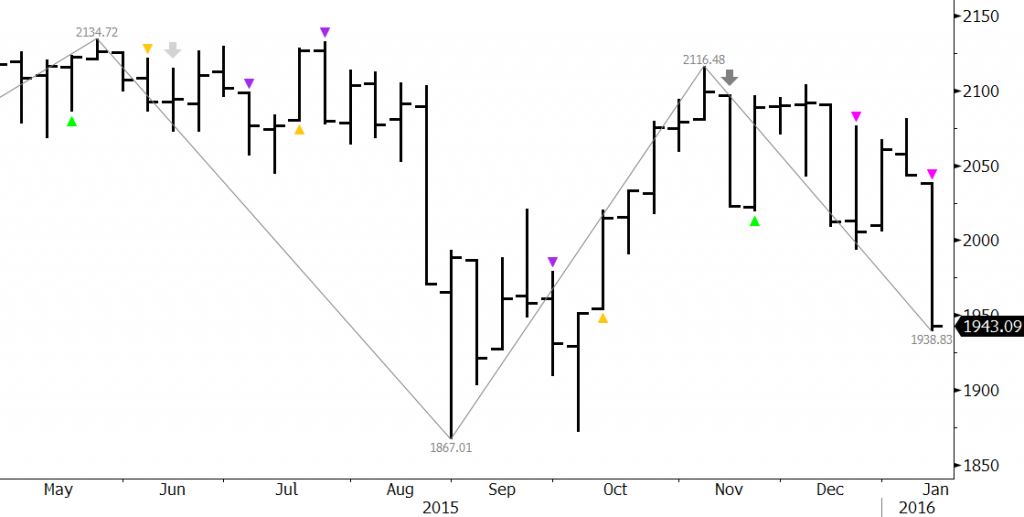
KaseX confirms the move down on the weekly chart. The recent overbought signal (gray arrow) and unfiltered short entries (pink triangles) indicate the decline should continue. On the daily chart, for those that are not already short, KaseX shows that it would be prudent to wait for a pullback and another confirmed sell signal (pink or purple triangle) after the recent short warning (yellow triangle).

SPX Weekly with KaseXSPX-Weekly

With all factors considered, the move down should continue and test the 1842 decision point in coming weeks. There is not enough technical evidence yet to definitively state that 1842 will hold. However, because of its importance, at a minimum, we expect at least a small upward correction to take place from 1842 once this target is met. Sustaining a close below 1842 would be extremely bearish for the long-term and could be the precursor to a bearish 2016.

This is a brief technical analysis of the S&P 500 Index based upon Kase’s technical forecasting models and trading indicator KaseX. If you are interested in taking a trial of KaseX please contact sales@kaseco.com. We would love to get your thoughts about the forecasted targets and probabilities. Leave a comment or send them along with your request for a trial to sales@kaseco.com.

By Dean Rogers

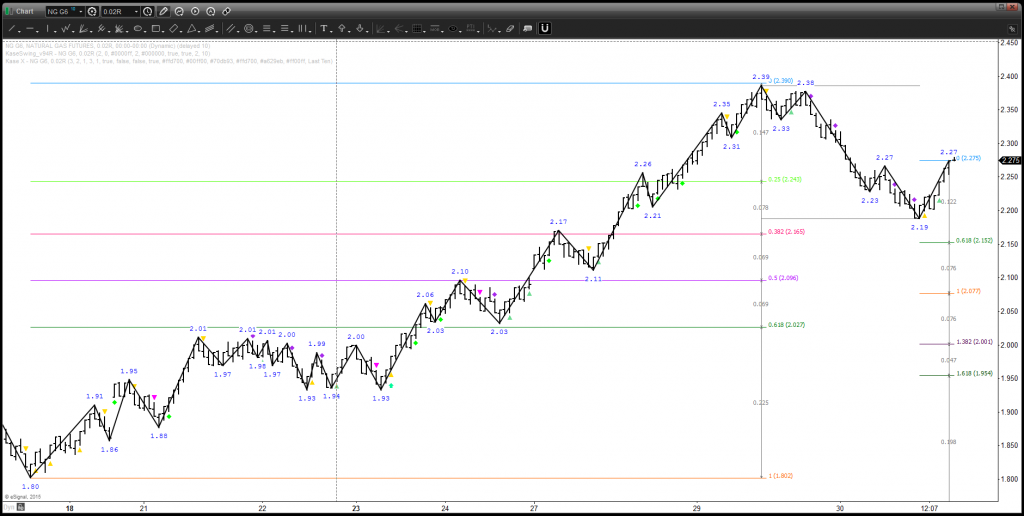
Evolving weather models that had previously predicted a cold spell in the Northeast U.S. and in the Great Lakes region are reportedly now forecasting above normal temperatures in early January. This could dampen the likelihood of a further price rally for natural gas in coming weeks, and the charts tend to agree.

Today’s decline was quite negative for the near-term outlook, and $2.16 is an important target that should be tested in coming days. This is near the 0.618 projection of the wave down from $2.386 and the 38 percent retracement of the move up from $1.80. A close below $2.16 would call for $2.09 and $2.03.

NG G6 - eSignal

That said, this is a tough call right now because the market still seems desperate to rally after recently falling to 16 year lows. Wednesday’s decline could be a correction of the move up as prices attempt to extend toward a highly confluent $2.51 level. The late rally in trading after hours on Wednesday indicates $2.31 and even $2.37 might be tested in early trading ahead of Thursday’s EIA Natural Gas Storage report. We expect $2.37 will hold.

It is a bit early to call for a trading range, but we get the sense that is the most likely scenario for natural gas in coming weeks. The boundaries of the range could be quite wide, between approximately $2.03 and $2.37. Trading over the next few days should give us a better sense of what is in store for natural gas prices in early 2016.

This is a brief natural gas forecast for the next day or so. Our weekly Natural Gas Commentary is a much more detailed and thorough analysis. If you are interested in learning more, please sign up for a complimentary four-week trial.

By Dean Rogers

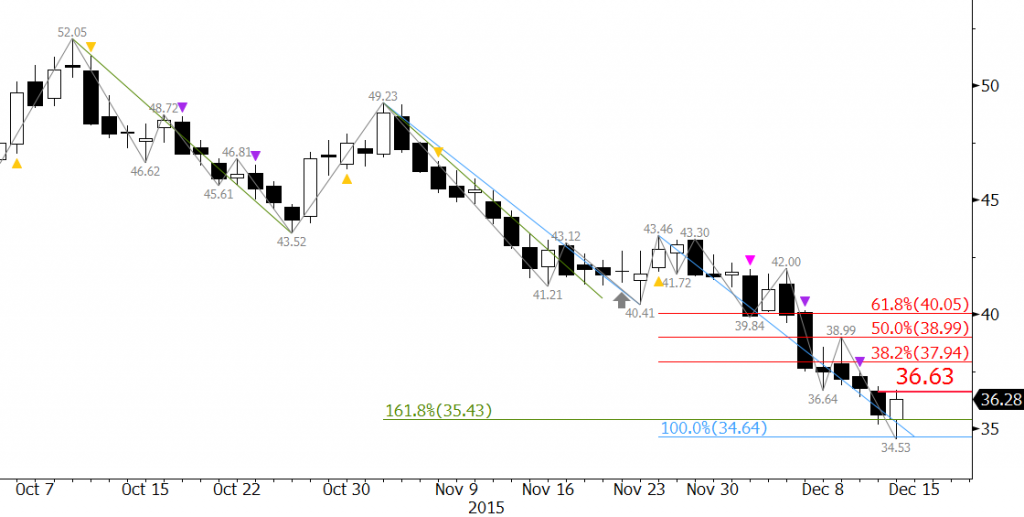
The darkest hour is just before the dawn. It is a phrase that most are familiar with that provides hope, even in the worst of circumstances. The outlook for WTI crude oil prices has been “dark” in recent weeks, and the longer-term outlook is still dim. However, December 14’s close over $36.13 provides a small shimmer of hope that a correction might finally be underway.

January WTI met a confluent and structurally crucial support target near $35.0 on December 14 and closed above December 11’s $36.13 midpoint to form a bullish piercing pattern. The piercing pattern is an early indication that a sustainable correction might finally be underway. A close over the pattern’s $36.63 confirmation point (December 11’s open) would call for at least $37.9, the 38 percent retracement from $43.46 to $34.53.

CLF6 20151214

The move up will most likely be corrective, but a substantial correction is long overdue. KaseX is not showing any signs of a turn yet, and the piercing pattern’s $36.63 confirmation point was tested and held. This dampens the likelihood of a reversal, but does not wipe out the potential completely. A close below $35.4 would negate the piercing pattern and call for the decline to continue towards the December 2008 perpetual swing low of $32.4.

Therefore, if the sun is going to rise $35.4 must hold and January WTI will need to close over $36.63 and then $37.9 within the next few days.

This is a brief analysis and outlook for the next day or so. Our weekly Crude Oil Commentary is a much more detailed and thorough energy price forecast. If you are interested in learning more, please sign up for a complimentary four week trial.

By Dean Rogers

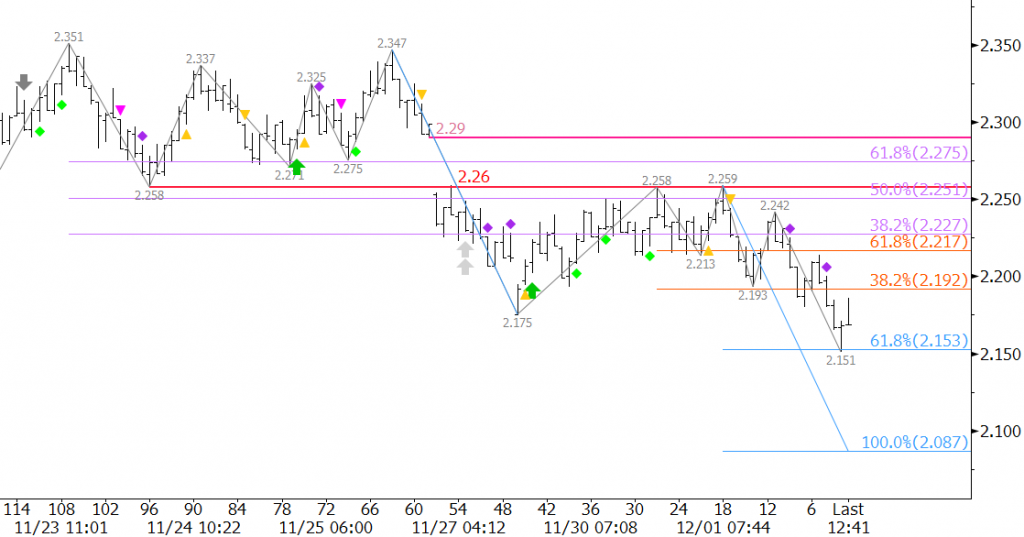
Natural gas is still looking for support from weather, but until cold temperatures arrive in key areas of the U.S. prices should continue to grind lower. The negative bias is confirmed by KaseX’s filtered short signal (purple diamonds).

Natural Gas

January futures met an important target at $2.15 on Wednesday. This was the 0.618 projection for the wave $2.347 – 2.175 – 2.259. A close below $2.15 would call for key support at $2.10, the 1.00 projection.

The importance of $2.15 indicates a correction might take place first, but look for resistance at $2.22 to hold. A close over $2.22 would call for $2.26 and possibly $2.30. A move higher than $2.30 is doubtful without support from weather.

This is a brief natural gas forecast for the next day or so. Our weekly Natural Gas Commentary is a much more detailed and thorough analysis. If you are interested in learning more, please sign up for a complimentary four week trial.

By Dean Rogers

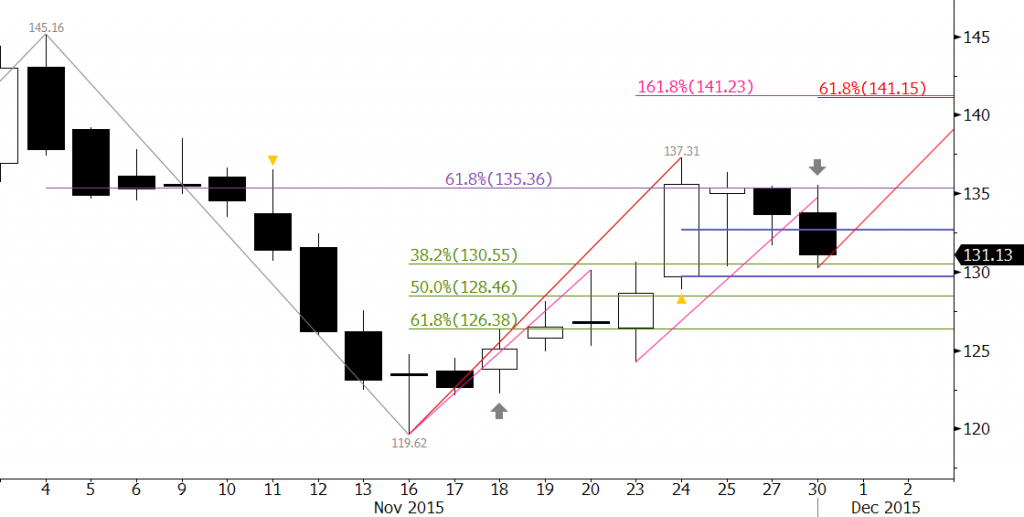
For the past few weeks gasoline futures rose in a dramatic fashion and lent some support to underlying WTI and Brent futures prices. However, a few bearish technical factors indicate the move up is probably complete and that a major test of support is now underway.

January gasoline futures stalled at the crucial 62 percent retracement of the decline from $1.4516 to $1.1962. In addition, Monday’s $1.3069 settle completed an evening star and hammer candlestick pattern and a moderately bearish overbought signal on KaseX (gray arrow). All three factors indicate the decline should continue.

XBF6 20151130

The pullback has retraced 38 percent of the move up from $1.1962 to $1.3731 so far. A close below $1.2972 will confirm the evening star and hammer and call for at least $1.285 and very likely $1.264, the 50 and 62 percent retracements, respectively. These are also confluent intraday wave projections.

From a technical standpoint, the move down is corrective of the move up until there is a close below $1.264. Odds for a move of this magnitude over the next week or so are 65 percent.

Look for resistance at $1.33 to hold. A close over $1.354 would be positive and open the way for $1.412 and higher.

This is a brief analysis and outlook for the next day or so. Our weekly Crude Oil Commentary is a much more detailed and thorough energy price forecast. If you are interested, please sign up for a complimentary four week trial.

By Dean Rogers

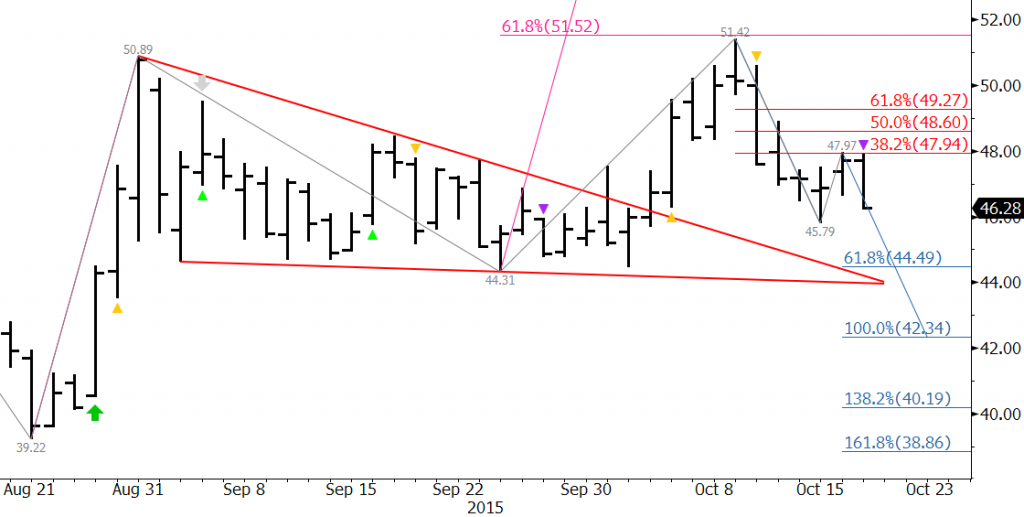
December WTI’s wave $39.22 – 50.89 – 44.31 met its 0.618 projection at $51.42. This was positive, especially due to the break higher out of the bullish pennant formation. We anticipated the pullback from $51.42, but so far it has been stronger than expected and is poised to test major support levels at $46.0 and $44.3.

Kase’s studies show that waves that meet the 0.618 projection extend to the 1.00 projection 80 percent of the time. This would have pushed prices to $56.0. However, the pullback from $51.42 has been strong and closed below $47.0 support on Monday. Therefore, this may be 20 percent of the time that a wave fails to meet its 1.00 projection.

CLZ5 20151019

First support is $46.0, and a close below this would open the way for $44.31. This is the swing low of the wave up from $39.22 and is in line with the 0.618 projection of the wave down from $51.42. Taking out $44.31 would result in a technical failure of the move up and call an extremely bearish outlook for foreseeable future.

Look for immediate resistance at $46.9, $47.6, and then $48.4.

This is a brief analysis and outlook for the next day or so. Our weekly Crude Oil Commentary is a much more detailed and thorough energy price forecast. If you are interested, please sign up for a complimentary four week trial.

By Dean Rogers

Spot natural gas is still looking a bit unsure of the move up, but the forward months, especially the winter strip, are looking reasonably positive. This likely indicates that a longer-term move up is underway, but for now it is looking like the prompt month could settle into a choppy trading range while it awaits more data (weather) to push natural gas prices higher or lower.

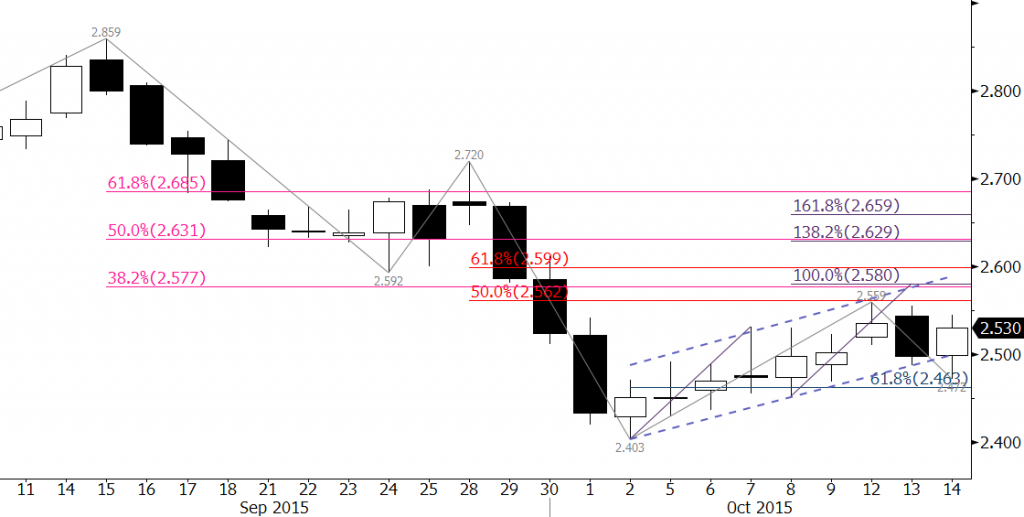
November futures stalled at $2.559 before reaching crucial resistance at $2.57. Tuesday’s bearish engulfing line was followed by a positive move on Wednesday. Resistance at $2.57 should be tested. A close over $2.57 would call for $2.63 which then connects to $2.68. First support is $2.49, but the key level for the near-term is near $2.43. A close below this would confirm the move up has failed and would open way for a new low.

NGX5 20151014

This is a brief natural gas forecast ahead of tomorrow’s EIA report. Our weekly Natural Gas Commentary is a much more detailed and thorough analysis. If you are interested in learning more, please sign up for a complimentary four week trial.