Brent Crude Oil Technical Analysis and Short-Term Forecast
This is a brief analysis for the next day or so. Our weekly Crude Oil Forecast is a much more detailed and thorough energy price forecasts that cover WTI, Brent, RBOB Gasoline, Diesel, and spreads. Daily updates are included. If you are interested in learning more, please sign up for a complimentary four-week trial.
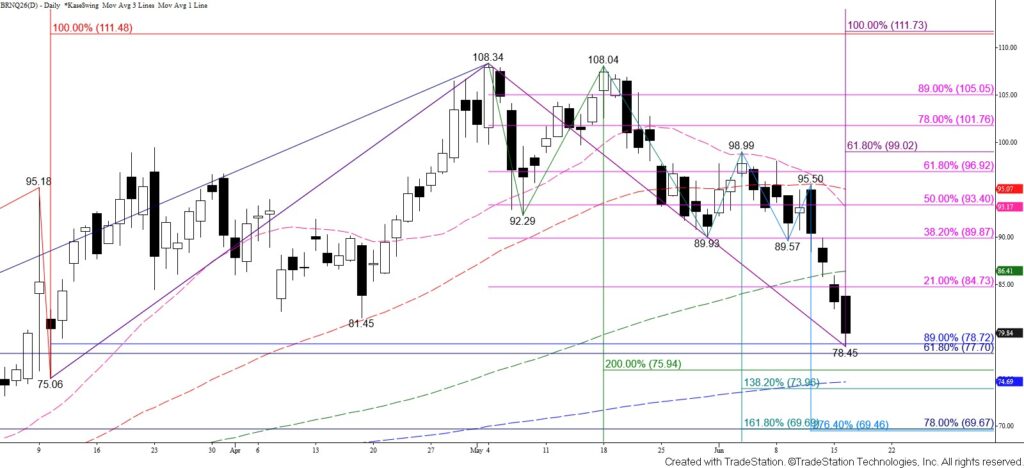
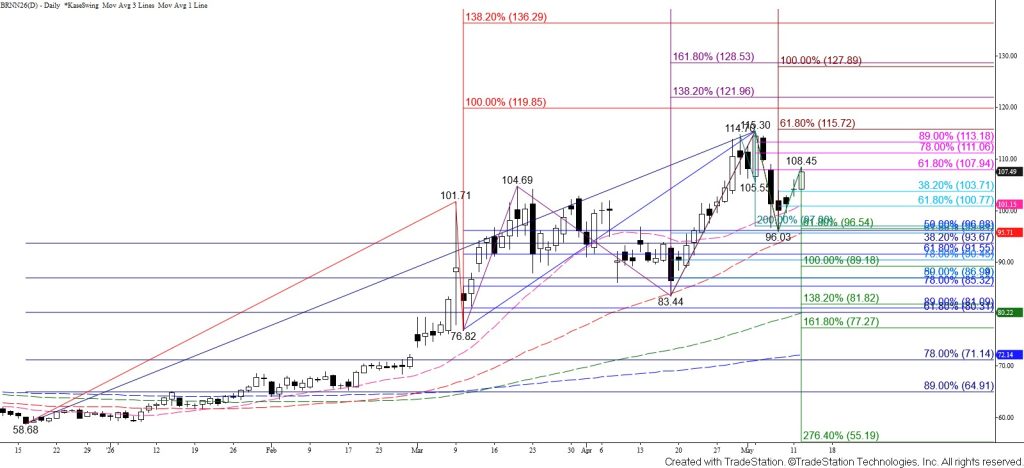
Brent crude oil continued to decline and took out the $81.45 swing low today. Prices also settled below the larger than (1.618) target of the waves down from $108.34 and $98.99 and the equal to (1.00) target of the wave down from $108.04. The 89 percent retracement from $75.06 held, but the wave formation calls for a continued decline. Tomorrow, look for a test of the 62 percent retracement from $58.76 at $77.7 and possibly the $75.9 target of the confirmed double top that formed between the $108.34 and $108.04 swing highs. Settling below $75.9 might initially be a challenge, but this will open the way for $74.1 and lower.
The daily Stochastic is oversold, and the RSI is nearing oversold territory. The move down is due for a corrective bounce, but there are currently no bullish patterns or confirmed signals that call for such a move. Even so, should prices rise, look for today’s $81.5 midpoint to hold. Key near-term resistance is today’s $83.8 open. Settling above this would put the near-term odds in favor of a more substantial correction before the move down extends.