Natural Gas Technical Analysis and Near-Term Outlook
This is a brief analysis for the next day or so. Our weekly Natural Gas Commentary and daily updates are much more detailed and thorough energy price forecasts that cover key natural gas futures contracts, calendar spreads, the UNG ETF, and several electricity contracts. If you are interested in learning more, please sign up for a complimentary four-week trial.
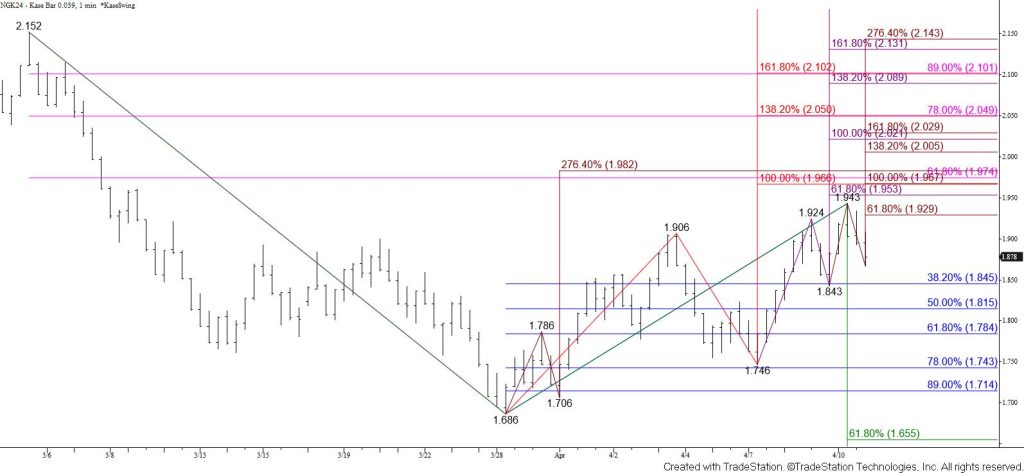
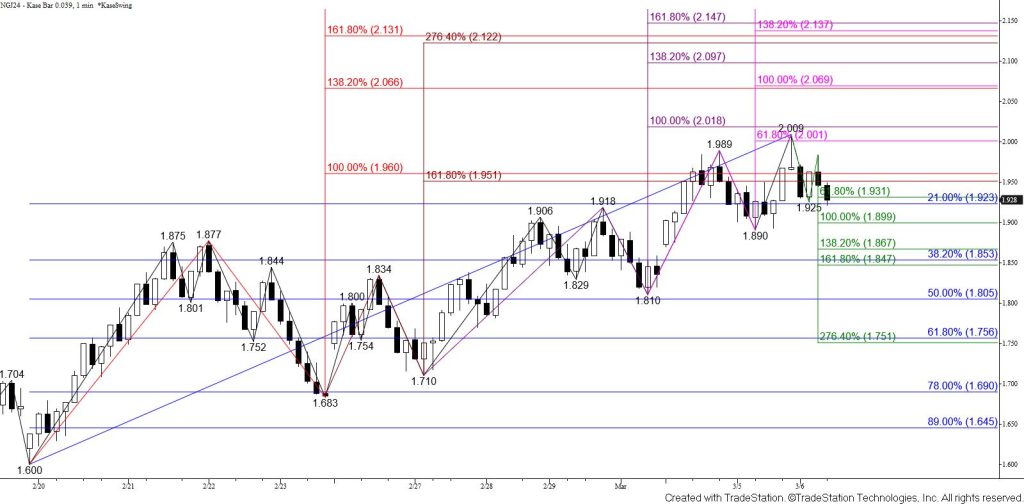
Natural gas rose above the $1.92 target as expected today but stalled at $1.943 before it could reach the $1.95 smaller than (0.618) target of the wave up from $1.746. The move up is still poised to extend because the primary wave up from $1.686 still favors a test of its $1.97 equal to (1.00) target. Furthermore, all prior swing lows that formed during the move up from $1.686 have held so far. Overcoming the $1.93 smaller than target of the most recent wave up from $1.843 will call for a test of $1.95 and likely $1.97.
With that said, the move up has begun to show signs of weakness. Pseudo daily shooting stars that formed Tuesday and Wednesday along with the pullback from $1.943 suggest a test of $1.85 might take place first. This is the 38 percent retracement of the rise from $1.686. A normal correction will hold $1.85. Falling below $1.85 will warn that the move up is failing and call for an extended test of support where $1.78, the 62 percent retracement, is key. Settling below this would shift near-term odds in favor of a continued decline or at least a period of consolidation before prices try to rise again.