Natural Gas Technical Analysis and Near-Term Outlook
This is a brief analysis for the next day or so. Our weekly Natural Gas Commentary and daily updates are much more detailed and thorough energy price forecasts that cover key natural gas futures contracts, calendar spreads, the UNG ETF, and several electricity contracts. If you are interested in learning more, please sign up for a complimentary four-week trial.
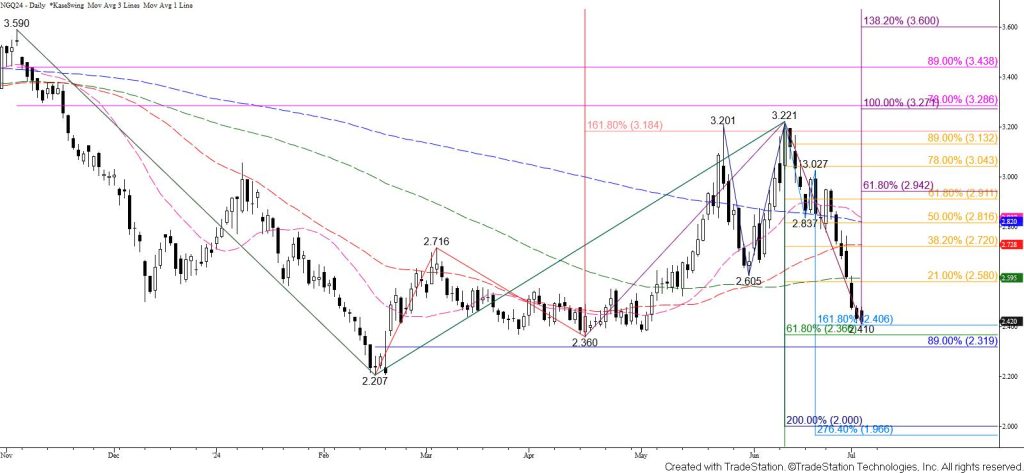
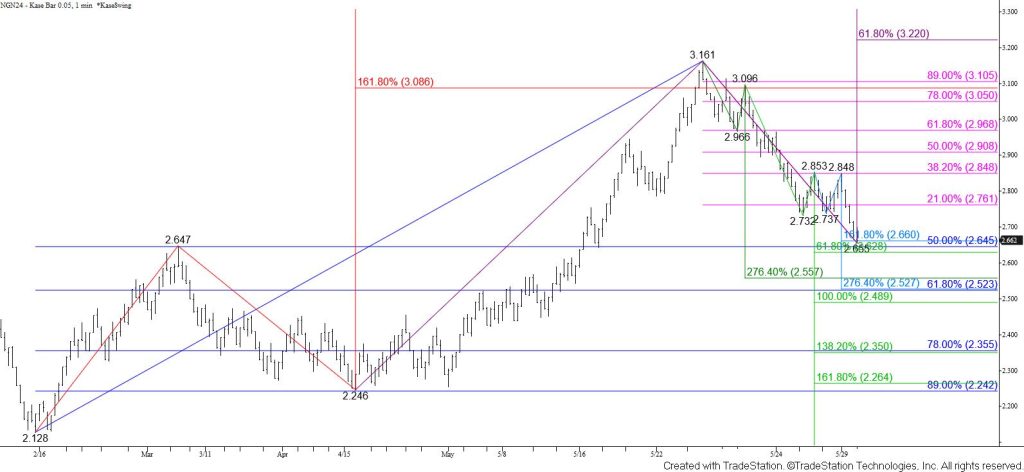
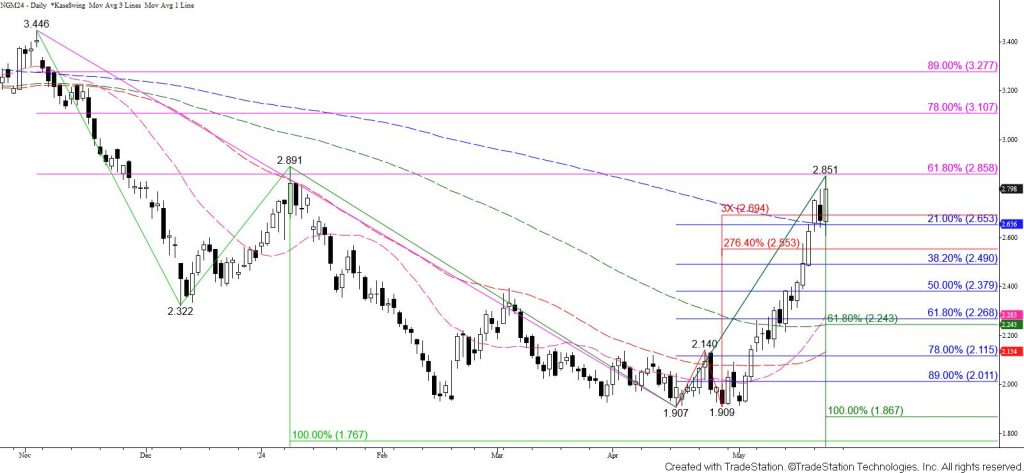
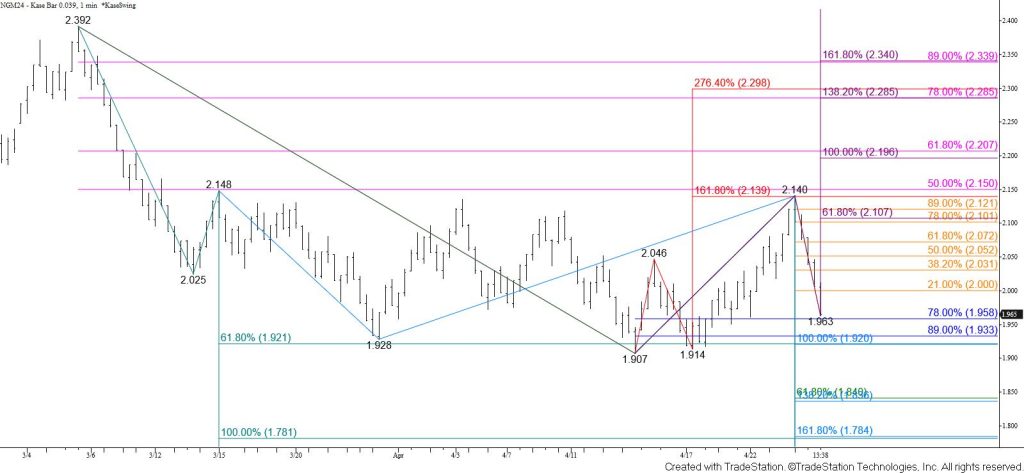
August natural gas has settled below the psychologically important $2.50 level for the past few days after confirming a double top that formed around $3.21. The double top’s target is $2.00, but it is doubtful that prices will fall this low. Prices also challenged the $2.41 larger than (1.618) target of the primary wave down from $3.221 today. This is a potential stalling point and the move down is due for a correction. However, there are no bullish patterns or signals that call for the move down to stall. Prices are also trading below all major daily moving averages, daily momentum is declining, and daily trend indicators are bearish. Therefore, the outlook remains bearish.
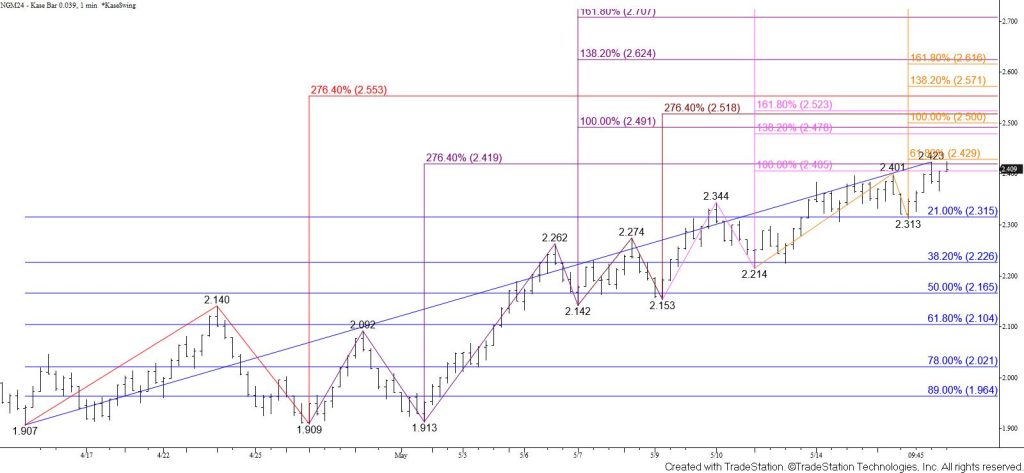
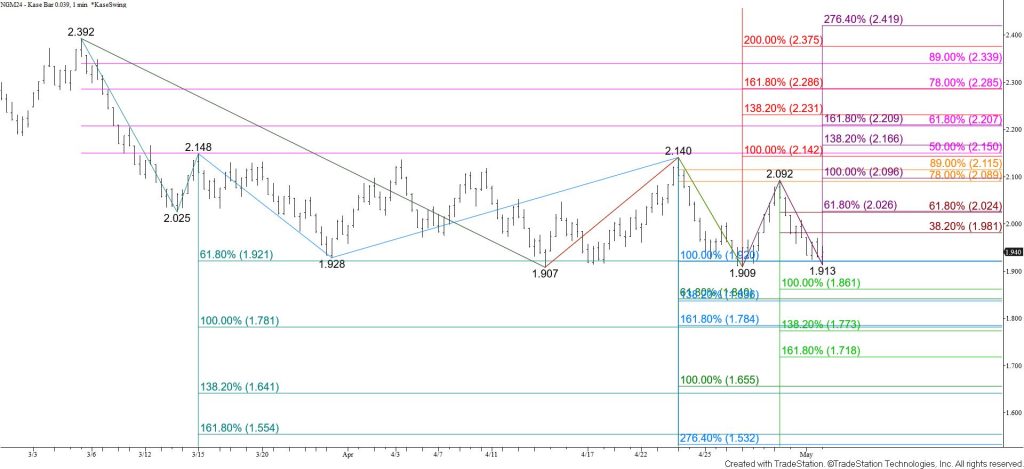
Tomorrow, look for a test of the $2.37 smaller than (0.618) of the wave down from $3.590. This is also a potential stalling point, so even though there are no bullish patterns or signals, there is still a reasonable chance for a correction soon. Closing below $2.37 will open the way for $2.32 and lower in the coming days.
Should prices rise before taking out $2.41 look for initial resistance at $2.48. Closing above this would call for a test of $2.52 and possibly key near-term resistance at $2.590. Settling above $2.590 would call for an extended correction where the next major threshold is the 38 percent retracement from $3.221 at $2.72.