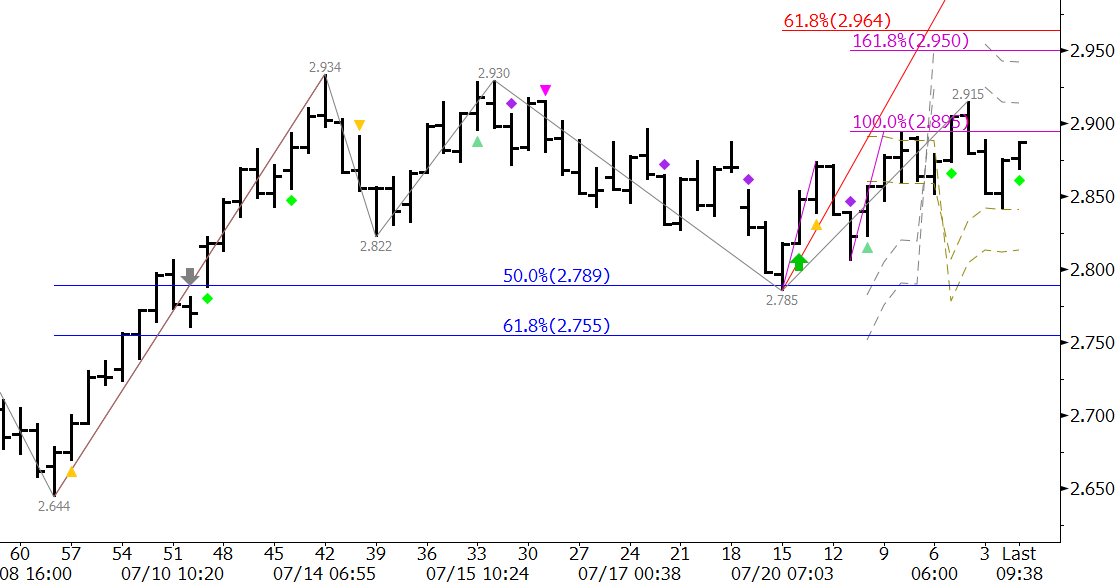
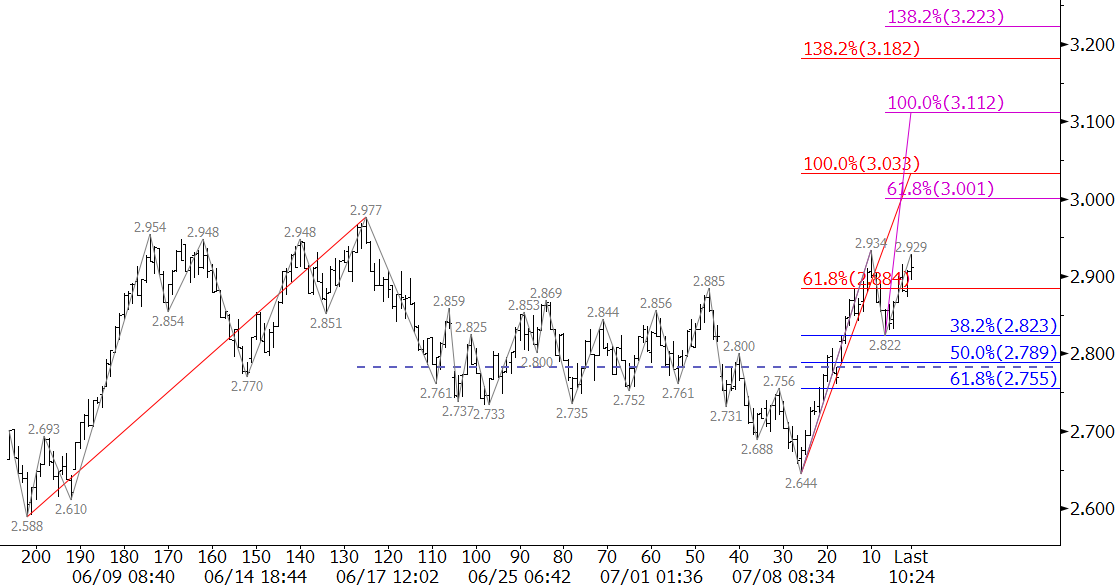
The price of natural gas, or any commodity for that matter, is theoretically the fair price at a given time. Traders will buy gas when they think prices are going to rise, and sell it when they think it will fall. This may be oversimplifying the process a bit (okay, a lot), but the point is that rising and falling prices are reflected on charts.
Charts tell us what traders and other market participants think about the market and the actions that they are taking (buying or selling). Interpreting price action on charts is the forte of technical analysis. Therefore, technical analysis is good at telling us what the market knows about itself, especially for the near-term.
For the long-term, technical analysis can be used as a guide, but people change their minds, and therefore, so does the market. When these changes of heart and mind take place, so does the direction of the market and the reflection of price action on the charts. As a result these changes are reflected in the underlying technical factors too.
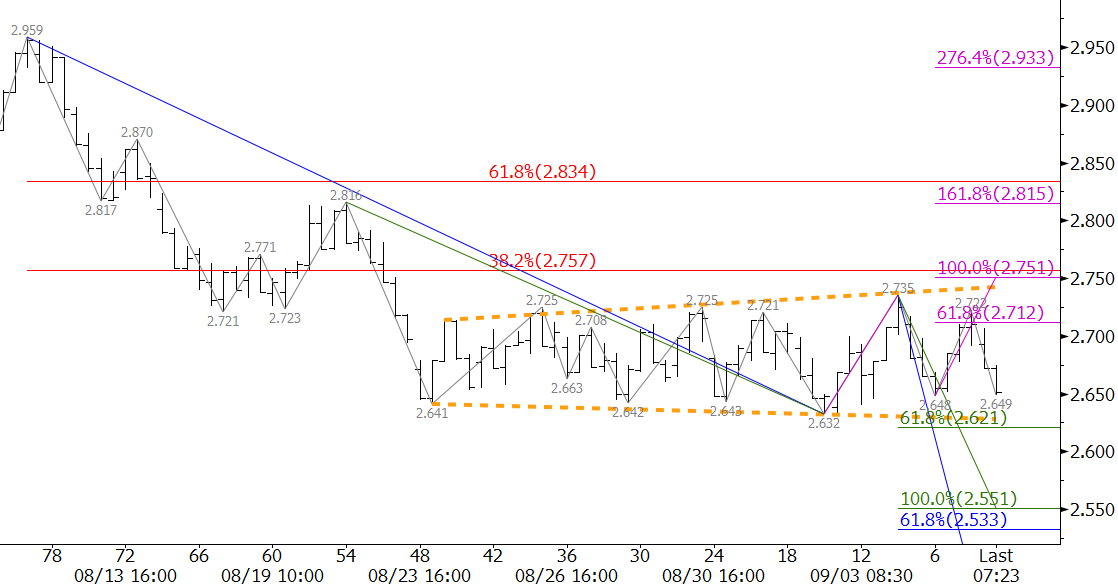
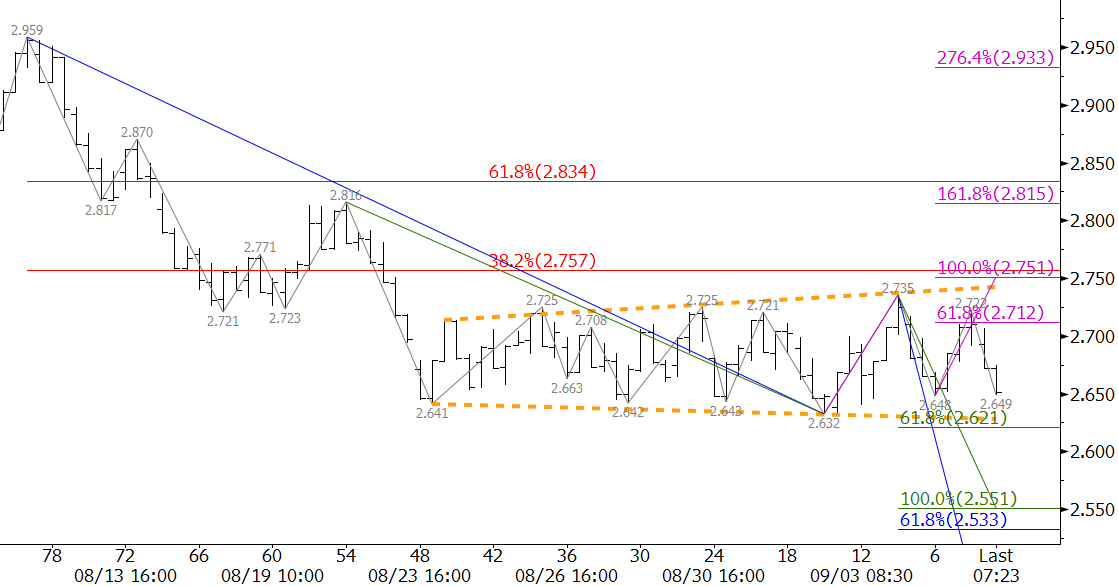
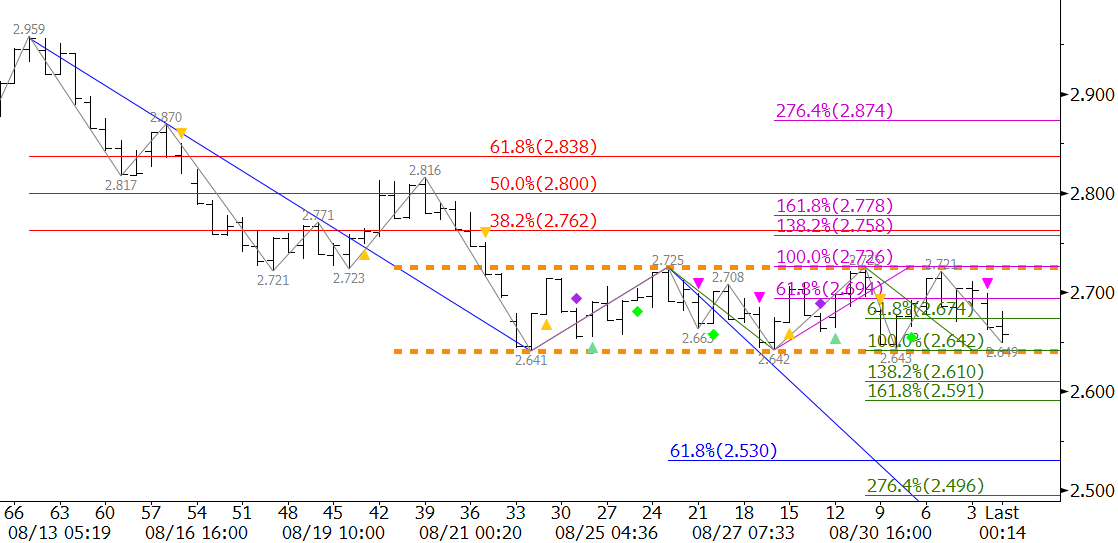
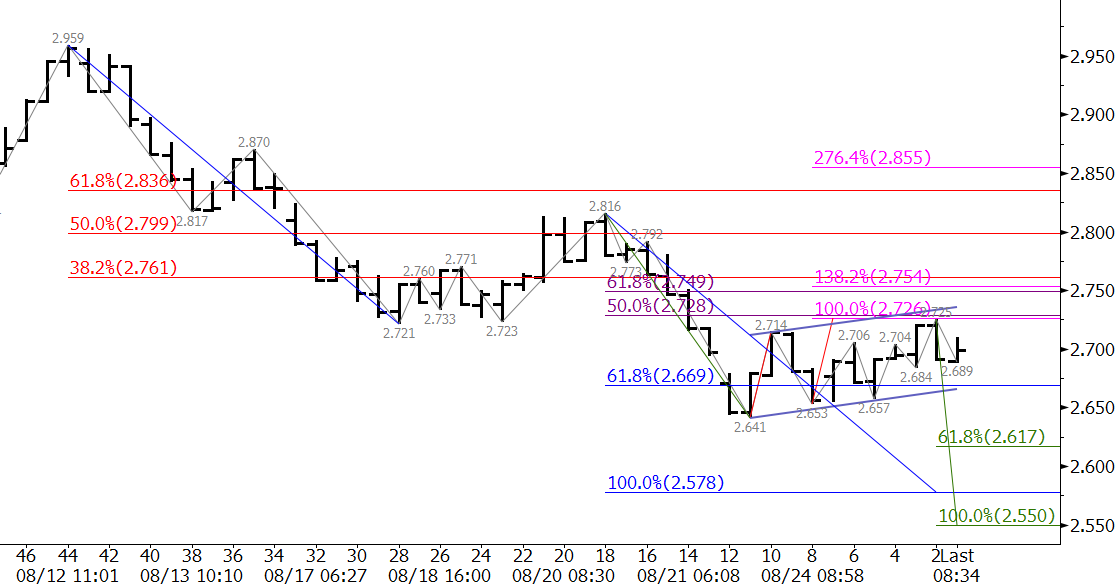
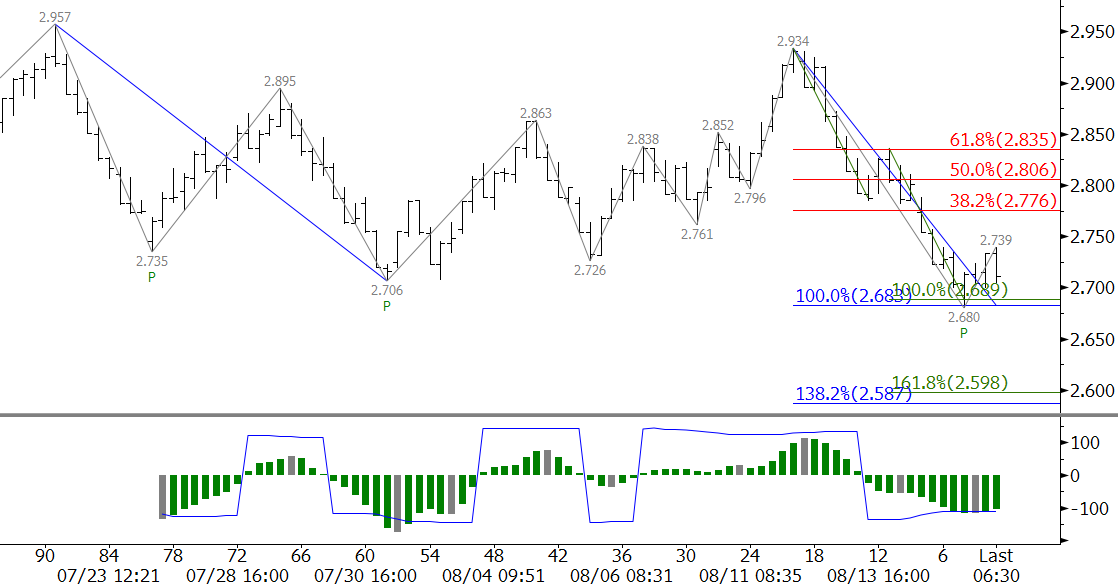
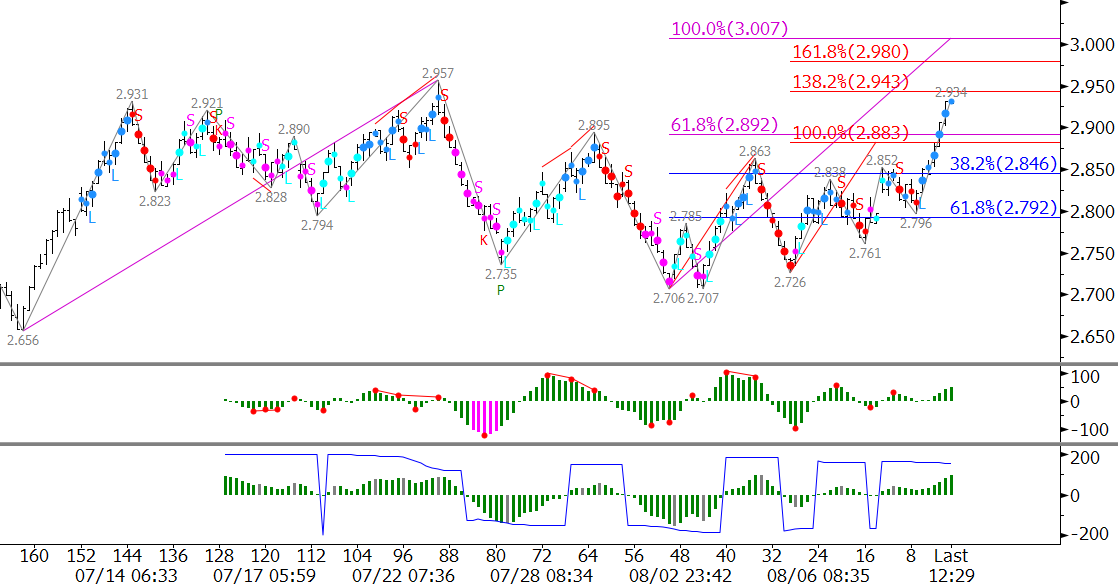
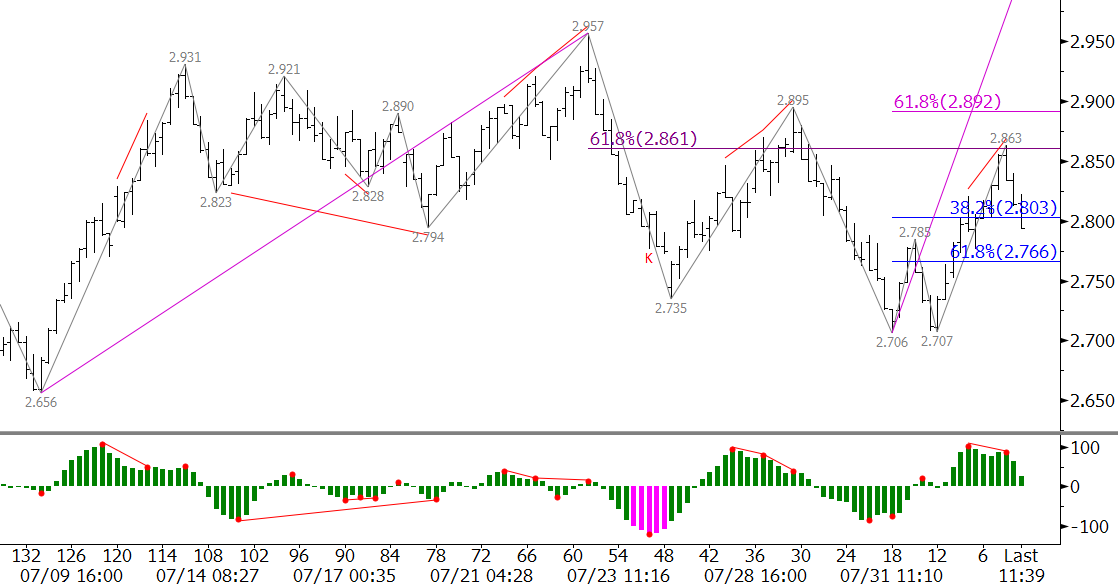
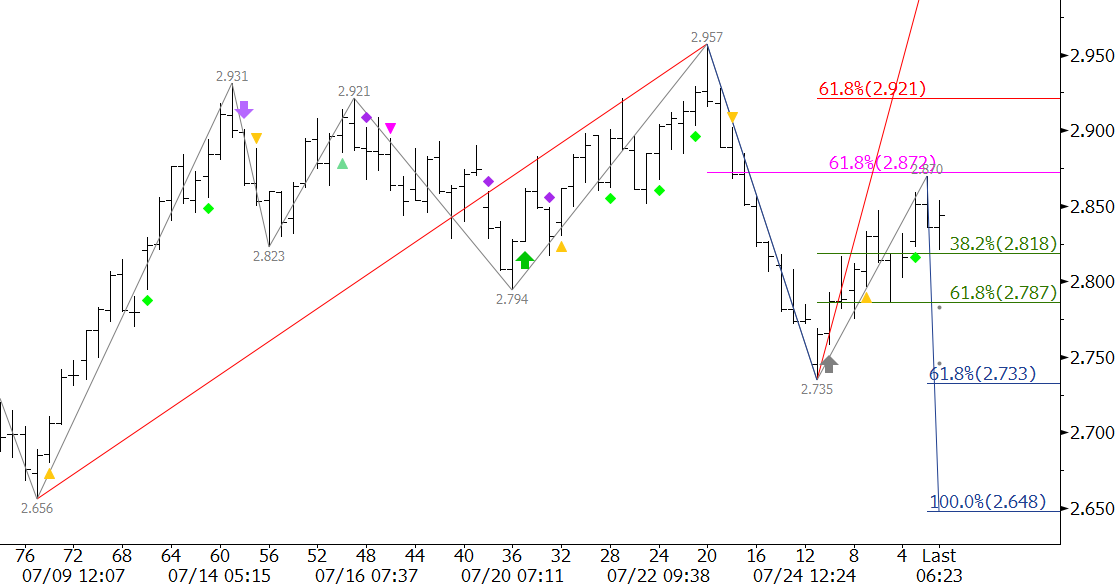
Here is what we are currently seeing on the daily chart and the $0.035 Kase Bar chart:
- Tuesday’s close above Friday’s midpoint was positive but the $2.716 open held.
- The move up was corrective and about the same size ($0.125) as prior corrections from $2.902 ($0.136) and $2.788 ($0.099).
- The KaseCD and KasePO momentum indicators are declining.
- The underlying KEES permissions (color-coded dots) are transitioning back to being short.
Therefore, for the near-term, the natural gas charts are tell us that prices will continue to decline to at least $2.54. This is a confluent support target and is the July contract’s low. It is too soon to say that prices will stall here. In fact, other than a correction once $2.54 is met, most technical factors call for prices to continue to decline to major targets we discuss at great length in our weekly Natural Gas Commentary.
Resistance at $2.79 is the 38 percent retracement of the decline and expected to hold. This threshold will be lowered to $2.76 once $2.54 is met.
This is a brief analysis ahead of tomorrow’s EIA report. Our weekly Natural Gas Commentary is a much more detailed and thorough analysis. If you are interested, please sign up for a complimentary four week trial.