The outlook for gold is bullish and the move up is poised to extend to the next major objective at $1798. However, the wave formation up from $1666.2 is due for a pullback. Therefore, a test of support is expected before $1798 is overcome on a sustained closing basis.
Gold held important support around $1665 on Tuesday and settled above the 62 percent retracement of the decline from $1788.8 today. This implies that the outlook remains bullish and rising above $1771 early tomorrow will clear the way for $1798. The $1798 objective is the smaller than (0.618) target of the wave up from $1576.0 and the highest the primary wave up from $1666.2 projects. As stated, a test of support is expected before $1798 is overcome. Nonetheless, closing above $1798 will clear the way for $1821, the equal to (1.00) target of the primary wave up from $1453.0.
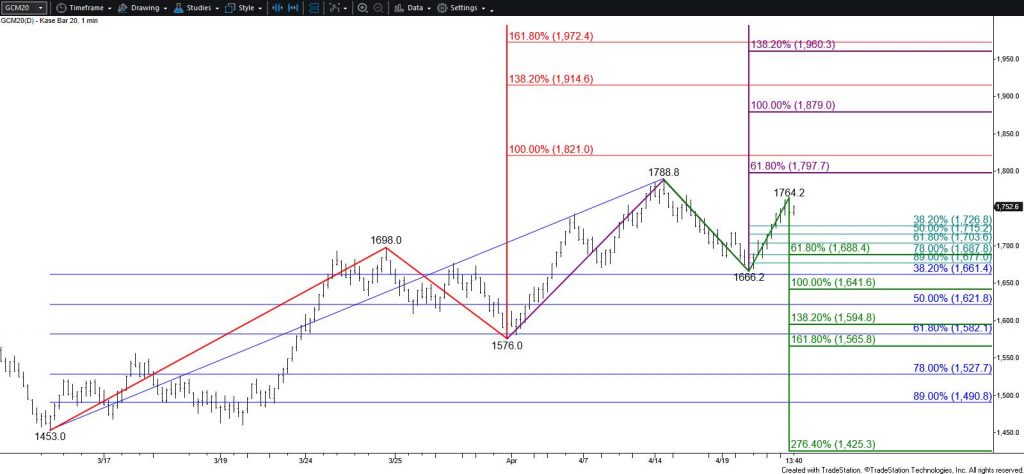
Prices fell a bit from the $1764.2 swing high at the end of the day. The wave formation up from $1666.2 is a bit extended, which suggests a test of support might take place first. Initial support at $1723 is expected to hold. Closing below this will delay the move to $1798 and would call for key support at $1688. Closing below $1688 is doubtful but would call for another attempt at $1665 and likely $1644 before the move up extends to a new high.
This is a brief analysis for the next day or so. Our weekly Metals Commentary and daily updates are much more detailed and thorough energy price forecasts that cover key COMEX precious metals futures contracts and LME Non-Ferrous (Base) metals, spot gold, the gold/silver ration, and gold ETFs. If you are interested in learning more, please sign up for a complimentary four-week trial.


