Gold Technical Analysis and Near-Term Outlook
This is a brief analysis for the next day or so. Our weekly Metals Commentary and daily updates are much more detailed and thorough energy price forecasts that cover key COMEX precious metals futures contracts and LME Non-Ferrous (Base) metals, spot gold, the gold/silver ratio, and gold ETFs. If you are interested in learning more, please sign up for a complimentary four-week trial.
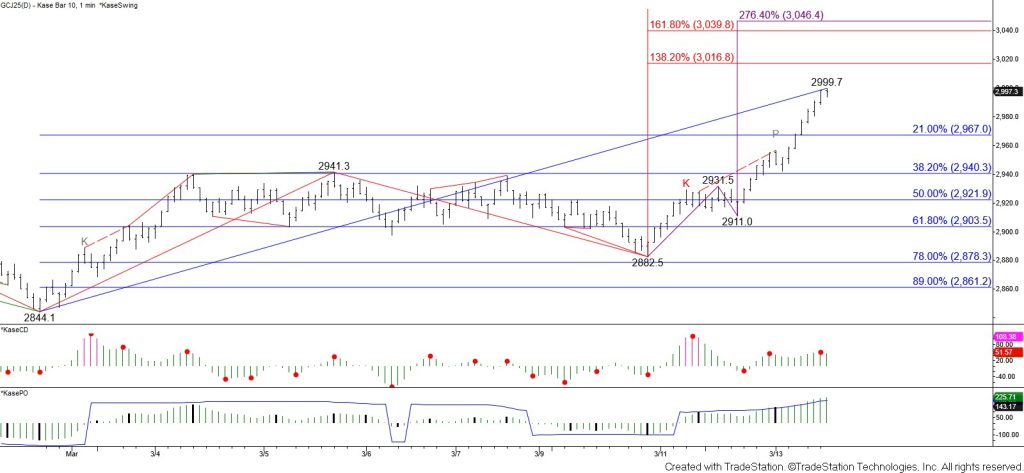
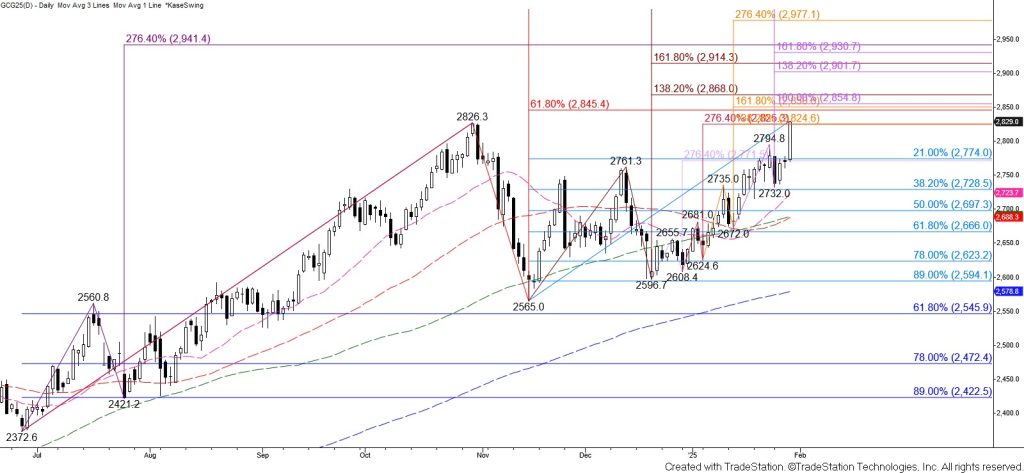
Gold rose to a new high and settled just below the psychologically important $3000 level. The wave up $2844.1 is now poised to test at least the $3017 intermediate (1.382) target and likely the $3043 larger than (1.618) target within the next few days. The $3043 objective is also the XC (2.764) projection of the wave up from $2882.5 and is an important projection for the larger-scale waves up from $2107.8 and $2392.4. Given that $3043 is the most confluent and important target on the chart, it is a potential stalling point.
There are no daily bearish patterns or signals that call for a reversal. However, the KasePO is overbought on the $10 Kase Bar chart. The KaseCD is also set up for a bearish divergence on this chart. Any move down will likely be a simple correction and should hold today’s $2967 midpoint. Today’s $2943 open is key near-term support.