RBOB Gasoline Futures Oscillating in Coil Pattern

Since mid-March prices for the May RBOB Gasoline futures contract have oscillated in a narrowing range and formed a coil pattern. Coils are patterns that indicate market indecisiveness, which has definitely been the case for the entire crude oil infrastructure since the beginning of the year. Coils are not as reliable as flags, pennants, and wedges at predicting the direction of the breakout, coils do tend to break in the direction of the trend, in this case down.

RBOB Gasoline

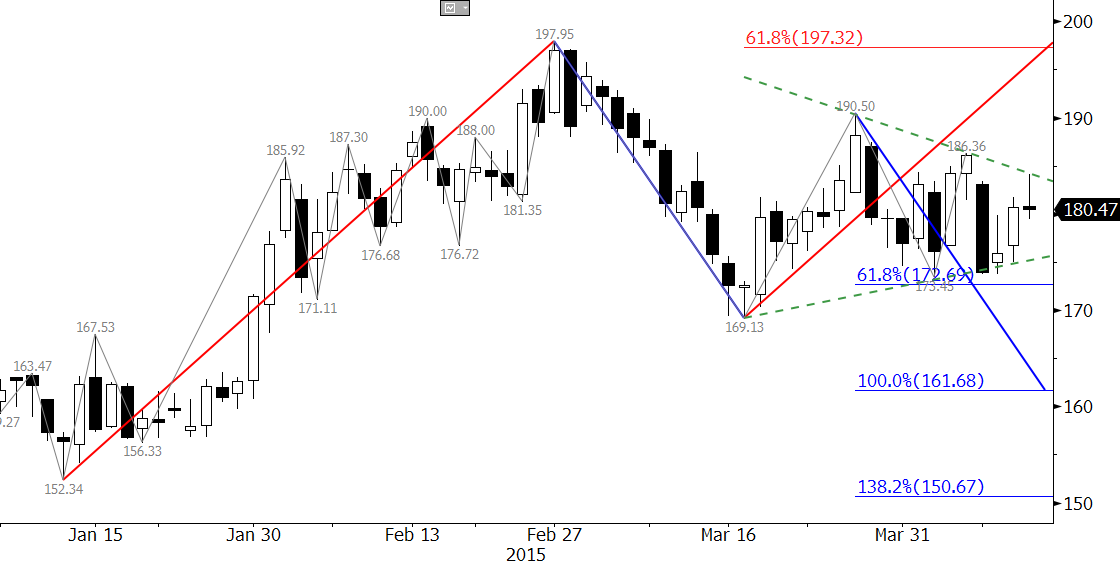
On Monday, the upper trend line of the coil was tested and held. Prices fell at the end of the day, and the evening star setup that formed indicates a test of support and the lower trend line of the coil should be tested later this week.

A close below 172.7, the 0.618 projection of the wave down from 197.95 would open the way for at least 161.7 and possibly 150.7 as he 1.00 and 1.382 projections, respectively.

A close over 185.0 would indicate prices have broken higher out of the coil and call for another test of crucial resistance at 197.3, which is the 0.618 projection of the wave up from 152.34.

Learn more about Kase’s weekly energy forecasts.

April gasoline prices fell for the fourth day in a row, but held support at 185.0. The bearish KaseCD divergence and underlying short permissions (red dots) indicate the decline should continue to 180.0. A normal correction will hold 180.0 because it is the 38 percent retracement of the move up from 149.64 and the 1.618 projection for the intraday wave down from 198.93 (not shown). A close below 180.0 would call for the 62 percent retracement at 168.5. This level must hold for gasoline prices to retain any chance at a continued recovery in the near term.

Learn more about Kase’s energy forecasts.

gasoline prices

RBOB Gasoline continued its decline and met a crucial target at 155.8 for the primary wave down from 315.2. The trend terminus (T = 156.3), is the lowest that most trends extend. However, there is no evidence that the decline is going to end. The next targets are 147.3 and 139.2. The KaseCD is setup for divergence and the KasePO is oversold, so a correction may take place soon. Last week’s midpoint and open are initial resistance at 168.1 and 176.5. A close over 176.5 would call for $198.3.

rbob


December RBOB futures met confluent support at $2.0776, and prices have subsequently settled into a coil formation that should break lower. However, a KasePO PeakOut (green P), indicates the move down is oversold and due for a correction. A directional break out of the coil will help to clarify the near term direction. Upon a break lower, look for $2.041 and then $1.915. Should the upward correction extend, watch for resistance at $2.240 and $2.368. The latter is expected to hold.

For more information and to take a trial of Kase’s weekly energy forecasts please visit the Energy Price Forecasts page.

XBZ4 Comdty


Successful long term hedging requires logical decision-making. Hedgers need to understand the underlying structure of the market and longer-term behavior in order to find points that minimize the risk and maximize the results of a hedge plan. It is also important to find the best balance for your company between budget oriented goals and achieving better than market prices. The HedgeModel identifies these low risk points and can be custom tailored to whatever strategy is befitting your mixture of goals and risk tolerance.

The HedgeModel is statistically based and does not require any previous trading experience to use. It is more-or-less mechanical and requires only 15 to 20 minutes per day to operate. It is data driven, so it works on any historic data stream in energy, including natural gas, crude oil, refined products, petrochemicals and crack spreads.

The Natural Gas Hedge Report is a companion product to Kase’s HedgeModel that includes a forecast for the perpetual, three-, six- and twelve-month strips. It also includes recommendations on how to set hedging strategies for the forthcoming quarter, changes to the settings used by HedgeModel, low-risk hedge targets, recommendations on what instruments to use, a track record and mark to market of recommended strategies, and research results.

Kase also performs ongoing research into market behavior and structure. Our research is oriented toward improving the results of our clients’ hedging strategies. In addition to a thorough evaluation of basis and correlation analysis, standard research in our quarterly Hedge Reports includes Monte Carlo simulations for estimating price distributions and objectives, statistical analysis of price and volatility, and cyclical behavior.

http://youtu.be/P3aigMq7h0A