Gasoline Price Forecast – March 18, 2025

Gasoline Technical Analysis and Short-Term Forecast

This is a brief analysis for the next day or so. Our weekly Crude Oil Forecast and daily updates are much more detailed and thorough energy price forecasts that cover WTI, Brent, RBOB Gasoline, Diesel, and spreads. If you are interested in learning more, please sign up for a complimentary four-week trial.

Gasoline rose to test and hold the 38 percent retracement of the decline from $2.4072 at $2.199 on a closing basis today. The subsequent move down from $2.2068 helped to form a daily shooting star. This implies that the corrective move up from $2.0702 is probably complete.

Moreover, today’s test of $2.199 likely completed Wave IV of a five-wave trend down from $2.4072. A test of at least $2.155 and possibly $2.140 is favored for tomorrow. The key target for the coming days is $2.121, the 62 percent retracement of the rise from $2.0702 and equal to (1.00) target of the wave down from $2.2068. Settling below this will provide more evidence that the corrective Wave IV is complete and that Wave V is underway.

That said, should gasoline settle above $2.199 the validity of the five-wave count will be called into question. Settling above $2.199 will also warn that the move down is failing and call for a much more substantial test of resistance where the next major threshold is the 50 percent retracement from $2.4072 and 200-day moving average at $2.239.

Gasoline Technical Analysis and Short-Term Forecast

This is a brief analysis for the next day or so. Our weekly Crude Oil Forecast and daily updates are much more detailed and thorough energy price forecasts that cover WTI, Brent, RBOB Gasoline, Diesel, and spreads. If you are interested in learning more, please sign up for a complimentary four-week trial.

Gasoline briefly fell below the 62 percent retracement of the rise from $2.0073 at $2.160 before testing and holding the smaller than (0.618) target of the wave down from $2.3486. The subsequent move up helped to form a daily hammer that warns a test of $2.208 and possibly $2.229 will take place tomorrow.

Nevertheless, it looks as though the move down from $2.4072 is forming a five-wave wave pattern where Wave III is in progress. The most probable stalling points for Wave III are $2.139 or $2.085. At $2.139, Wave I down from $2.4072 will fulfill its larger than (1.618) target. At $2.085, Wave 1/III will fulfill its XC (2.764) projection and Waves 1/III and 3/III will be equal. Taking out $2.169 will call for a test of $2.139, a close below which will call for a test of the $2.115 smaller than (0.618) target of the wave down from $2.480 and then the $2.085 objective. Wave IV is expected to form before taking out $2.085.

That said, today’s $2.1502 low might have been enough to fulfill the $2.139 larger than target of Wave I. Furthermore, holding $2.160 and the formation of a daily hammer warn that Wave IV might already be underway. Closing above $2.229 will confirm today’s hammer and call for a test of the 38 percent retracement of the decline from $2.4072 at $2.248. This is also the 200-day moving average and sits just below the $2.2595 swing low of Wave I. Therefore, for the five-wave pattern to remain intact, $2.248 must hold. Overcoming this will call for a test of $2.279. Such a move would push the potential Wave IV above the bottom of Wave I. This typically implies that the five-wave move has failed and is more likely a nested three-wave pattern instead.

The bottom line for gasoline is that the move down is still expected to extend. However, there is a good chance for a test of $2.208 and $2.229 first. Settling above $2.229 and then $2.248 will call the five-wave count down from $2.4072 into question and reflect a bullish shift in near-term sentiment.

Since early February, RBOB gasoline futures have been trending higher, forming a five-wave pattern. We follow a few simple rules when breaking down a five-wave move. Generally, each of the impulse waves (I, III, V) have to be proportional to one another, each of the impulse waves should break down into five-sub-waves, and most importantly, at least two of the impulse waves should be equal.

The May gasoline contract is nearing a very important decision point at 159.5. This is the 0.618 projection of Wave III. Stalling at 159.5 would fulfill our requirements for a five-wave trend because Waves I and V would be equal. In addition, Wave III would be 1.618 the size of Waves I and V.

XBK6 20160328

Should May gasoline futures close over 159.5, look for 171.0. This is the 2.764 projection for Wave I and the 1.00 projection for Wave III. In this case Waves III and V would be equal.

For the move up to extend to 159.5 in the near-term the 141.61 swing low of Wave IV should hold. This is also near the 38 percent retracement of the move up from 114.88. A close below this would call for 134.4 and likely 129.8.

Right now it appears as though the move up should continue to at least 159.5. Currently, gasoline’s rise is likely supporting crude oil prices too. Therefore, if the move up fails, and gasoline prices fall, they may also lead crude oil prices lower.

This is a brief analysis and outlook for the next day or so. Our weekly Crude Oil Commentary is a much more detailed and thorough energy price forecast. If you are interested in learning more, please sign up for a complimentary four-week trial.

By Dean Rogers

For the past few weeks gasoline futures rose in a dramatic fashion and lent some support to underlying WTI and Brent futures prices. However, a few bearish technical factors indicate the move up is probably complete and that a major test of support is now underway.

January gasoline futures stalled at the crucial 62 percent retracement of the decline from $1.4516 to $1.1962. In addition, Monday’s $1.3069 settle completed an evening star and hammer candlestick pattern and a moderately bearish overbought signal on KaseX (gray arrow). All three factors indicate the decline should continue.

XBF6 20151130

The pullback has retraced 38 percent of the move up from $1.1962 to $1.3731 so far. A close below $1.2972 will confirm the evening star and hammer and call for at least $1.285 and very likely $1.264, the 50 and 62 percent retracements, respectively. These are also confluent intraday wave projections.

From a technical standpoint, the move down is corrective of the move up until there is a close below $1.264. Odds for a move of this magnitude over the next week or so are 65 percent.

Look for resistance at $1.33 to hold. A close over $1.354 would be positive and open the way for $1.412 and higher.

This is a brief analysis and outlook for the next day or so. Our weekly Crude Oil Commentary is a much more detailed and thorough energy price forecast. If you are interested, please sign up for a complimentary four week trial.

By Dean Rogers

Last week several top refiners reported a jump in their third quarter earnings compared to a year ago. Attractive crack spreads and refining margins due to lower oil prices and healthy demand for gasoline have helped refiners pump in profits. In addition, last week’s rise in oil prices, which was partially attributed to a quick turnaround in the refinery maintenance season, has helped to stabilize gasoline futures and open the way for a test of key resistance near $1.43.

December gasoline futures have oscillated in a trading range bound between approximately $1.26 and $1.43 since early September. The most recent move up from $1.26 overcame resistance at $1.36 and is now poised to test the upper boundary of the range at $1.43. This is the 2.764 projection for the small wave $1.2621 – 1.323 – 1.2627, the 0.618 projection for the wave $1.1756 – 1.4604 – 1.2621, and the 38 percent retracement of the decline from $1.8392 to $1.1756. There is a good chance that $1.43 will hold, but a close over this would open the way for at least $1.55.

XBZ5 20151102

The Kase Easy Entry System (KEES), which is based upon a sophisticated algorithm that accounts for multiple momentum indicators, bar lengths, swings, and bar structure, confirms the positive bias in the near term. The blue dot indicates that the underlying indicators and bar lengths are permissioned for long trades to be taken.

Prices are expected to reach at least $1.43 before another turn lower to test support takes place. For now, look for immediate support at $1.31 and for key support at $1.26. A close below the latter would call for the late August low of $1.1756 to be challenged.

This is a brief analysis and outlook for the next day or so. Our weekly Crude Oil Commentary is a much more detailed and thorough energy price forecast. If you are interested, please sign up for a complimentary four week trial.

5c1050e7d305921d3b87cdb35a1e42ffby

Read on TraderPlanet

“Ask Kase” and your question may be chosen as the subject of a future column (askkase@kaseco.com).

With VW cheating on diesel fuel emissions and standards being scrutinized worldwide, interest in electric vehicles may increase longer-term, and medium-term, gasoline fueled vehicles might pick up. But will gasoline prices get a boost any time soon? Probably not.

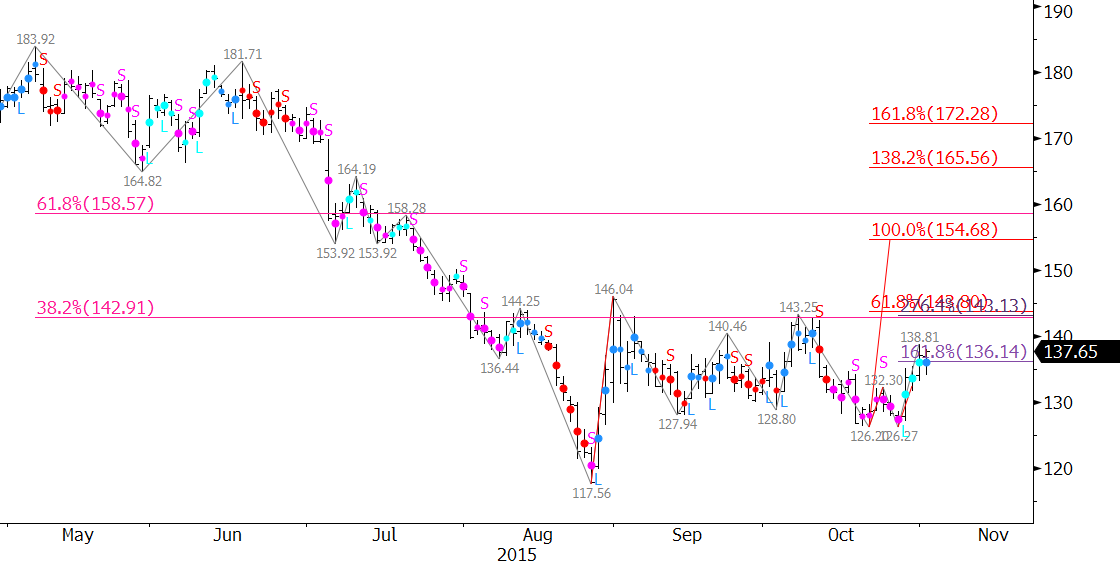
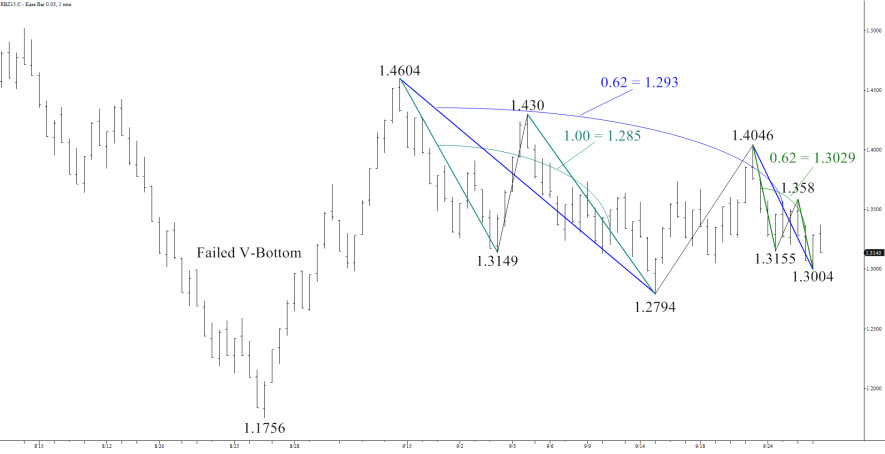
December gasoline, which becomes prompt in two days, traded up to $1.4604 at the end of August. Since then it’s been caught in a downward oscillating pattern, but remains above its earlier $1.1756 low.

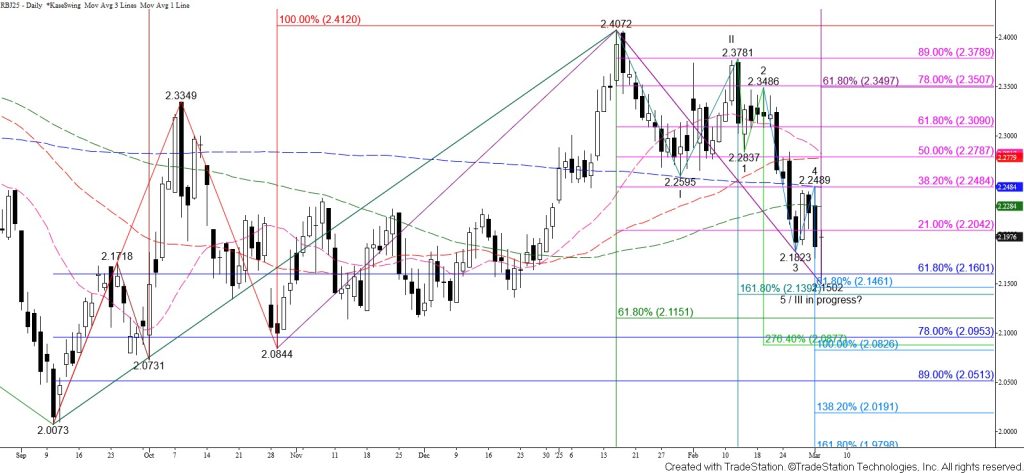
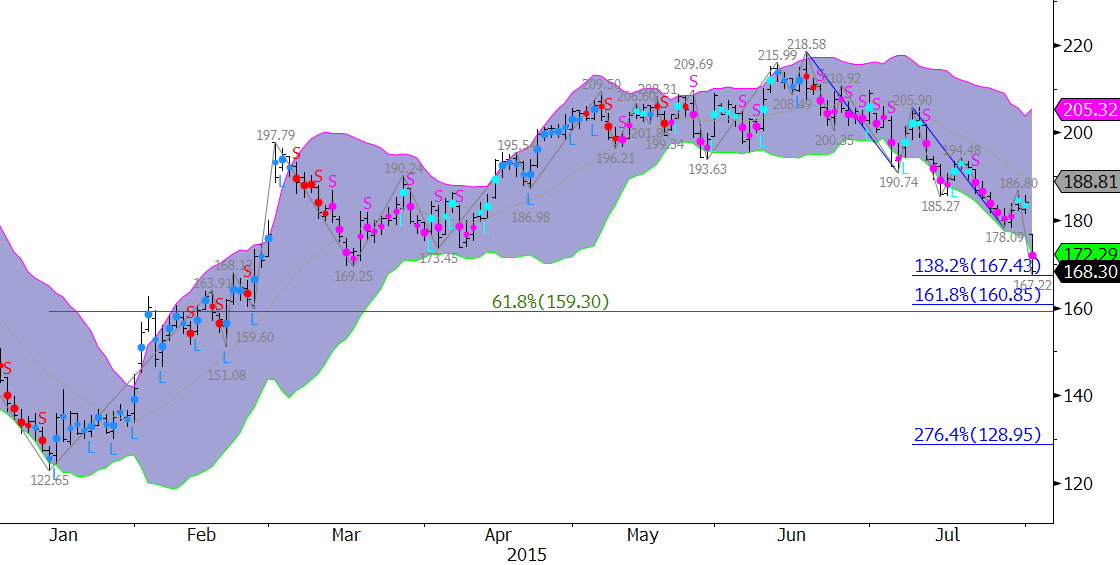
Odds favor the downside. This was a large down month which prevented a bullish reversal pattern from completing. On the daily chart, the decline to and bounce up from $1.1756 was a bullish V-bottom but failed. The decline from $1.4604 was interrupted by a bullish flag which has since broken lower. The perpetual has been steadily dropping since mid-June, only going into a sideways stall during the past two weeks.

RB-Fig1

Charts created using TradeStation. ©TradeStation Technologies, Inc. 2001-2015. All rights reserved. No investment or trading advice, recommendation or opinions are being given or intended.

Odds of a recovery are higher than for a normal trending market. The decline from $1.4604 only met the minimum 0.62 extension. The decline has also been shallow.

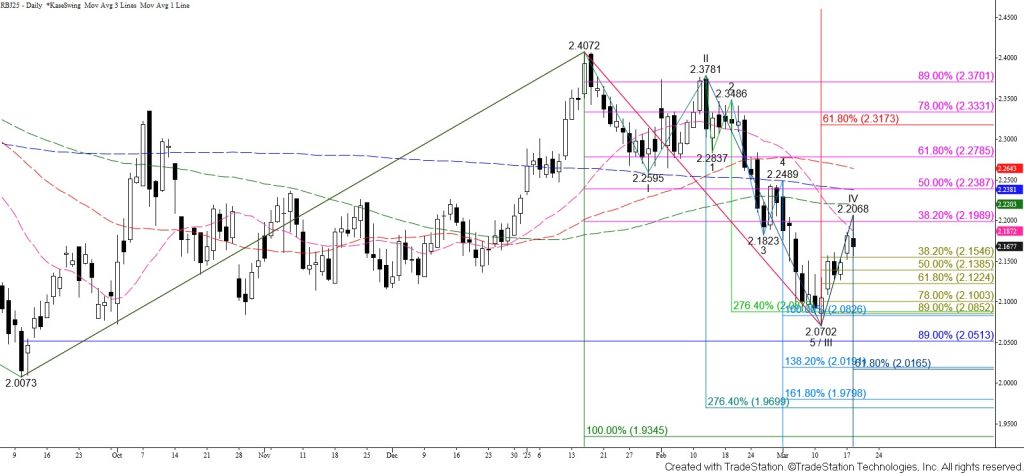
Two very strong layers of support are $1.235 and $1.205, respectively the 78 percent and 89 percent retracements of the $1.1756 to $1.4604 rise. $1.235, less than one cent above the perpetual’s January low, is important because it’s only generated by the waves down from $1.4604. For the six waves down from this price, $1.235 is a wave extension for five, and as a corrective projection for three. Thus, should $1.235 hold, there is no connection to larger, earlier waves which project to lower levels. The next layer at $120.5 connects back to the mid July $1.5828 high. This support level could engender a trading range between the $1.20s and $1.50s, so watch out for that.

Even though the previous low of $1.1756 is natural support, a close below $1.205 could trigger a steep decline down to $1.06. This is because the wave extensions tie the two prices together. The wave 158.28 – 117.56 – 146.04 targets $1.205 as the 0.62 extension and $1.06 as the equal, 1.0, extension. 140.46 – 130.04 – 133.73 targets $1.205 as the 1.38 extension and $1.06 as the 2*1.38 extension. The point is that should there be a close below $1.205, the pull from $1.06 grows.

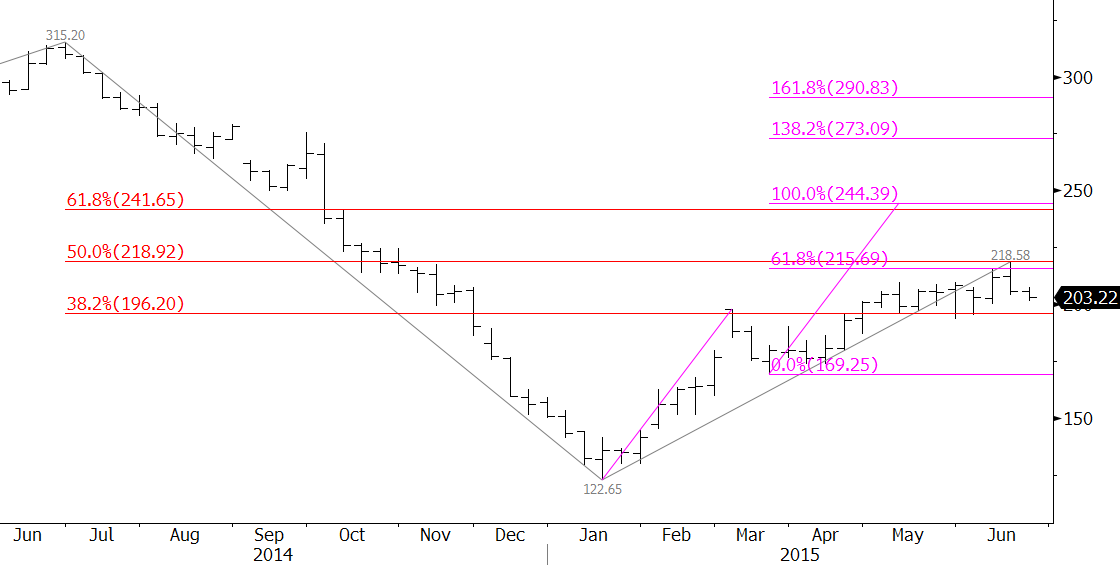
Adding to that pull is that $1.06 is the 89 percent retracement of the move up from the 2008 low of $0.785 to 3.48. Hitting $1.06 could cause a slide below the $1.00 level.

So watch to see if the two targets in the $1.20s hold – or not.

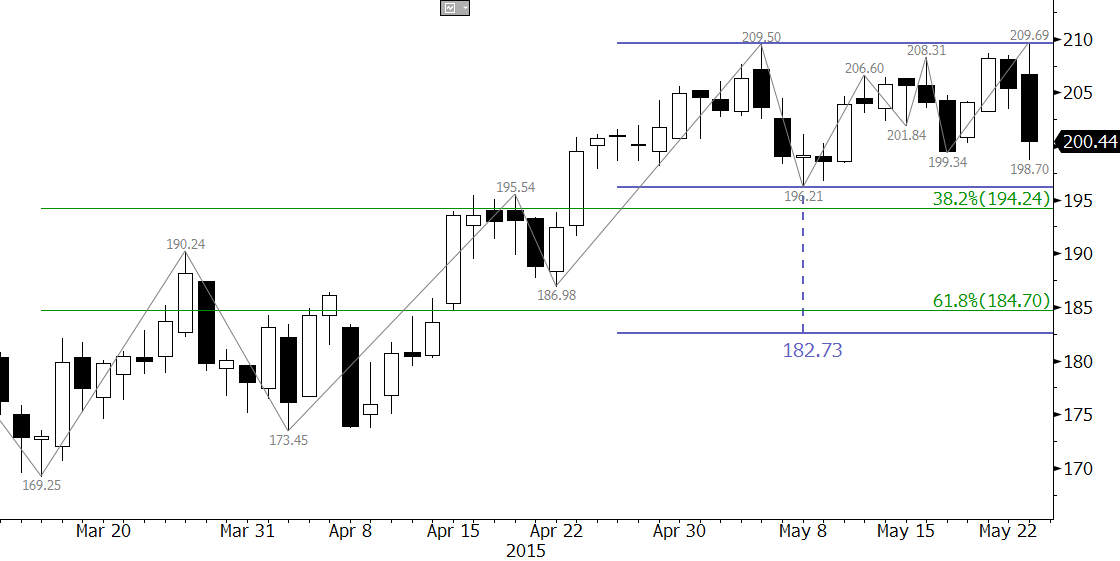
A close over $1.375 would argue for concern that the move up from $1.1756 will extend. That’s the price above which I wouldn’t hold short-term short position. Above $1.4604 the contract is in for a further recovery. Either way, moderate prices, well below prices should prevail. So fill up the tank, and get on the road before December snows slow you down!

Send questions for next week to askkase@kaseco.com, and click the link to learn more about Cynthia Kase’s latest video series, Kase on Technical Analysis.

By Dean Rogers

RBOB Gasoline futures tested support at 167.43 on Monday and have taken out the crucial 169.25 swing low. The outlook is negative, but many technical factors, including Monday’s dip below the lower Bollinger Band, indicate a correction should take place once 160.0 is met. This is the confluence point between the 62 percent retracement of the move up from 122.65 and the 1.618 projection for the primary wave down from 218.58.

gasoline

Look for resistance at 172.3 and 181.3. The latter is expected to hold.

This is a brief analysis and outlook for the near-term. Our weekly Crude Oil Commentary is a much more detailed and thorough energy price forecast. If you are interested, please sign up for a complimentary four week trial.

The RBOB gasoline crack spread widened to $25.64 on Monday and could test $27.77 before narrowing again. Resistance near this level is expected to hold and the crack is poised to narrow now that the 0.618 projection of the wave down from $33.80 was met. We would look to short the crack spread soon because KaseX generated a filtered sell signal on June 25th. The key target at $19.00 is the 1.00 projection and the top of the gap that took place on February 23rd.

crack spread

This is a brief analysis and outlook for the near-term. Our weekly Crude Oil Commentary is a much more detailed and thorough energy price forecast. If you are interested, please sign up for a complimentary four week trial.

RBOB gasoline prices are weak after stalling at 218.58. This was an important confluence point because it was the 50 percent retracement of the decline from 315.2 and the 0.618 target for the wave up from 122.65. The move up was exhausted once it reached 218.58 and negative factors like a bearish KasePO divergence have shifted near-term odds in favor of a pullback to 199.7 and 188.1 over the next few weeks.

RBOB Gasoline

That said, the pullback is most likely corrective.

Our studies show that nearly 80 percent of waves that meet the 0.618 target extend to at least the 1.00 target, which is 244.39 for the wave up from 122.65. This is also near the 62 percent retracement from 315.2. The only way to negate a wave’s projections is to take out the swing low of its correction, in this case, 169.25. Therefore, while 169.25 holds the longer-term outlook for gasoline is positive and favors an extension to 244.39.

Taking out the 244.39 swing low would be extremely bearish for gasoline prices. Right now we don’t that will be the case, but closing below 188.1 support will go a long way to increasing the odds of ultimately taking out 169.25.

This is a brief analysis and outlook for the next day or so. Our weekly Crude Oil Commentary is a much more detailed and thorough energy price forecast. If you are interested, please sign up for a complimentary four week trial.

Gasoline futures formed a double top at approximately 209.5 after attempting to overcome this crucial area of resistance in early trading Tuesday. The double top and confirmed dark cloud cover call for at least 195.0. This is a crucial decision point for an extended correction because 195.0 is in line with the 196.21 swing low and 38 percent retracement from 169.25. A close below 195.0 will confirm the double top and open the way for its target near 183.7, which is also near the 62 percent retracement.

Take a trial of Kase’s weekly energy forecasts.

gasoline