Natural Gas Forecast: Correction Favors $2.38

By Dean Rogers

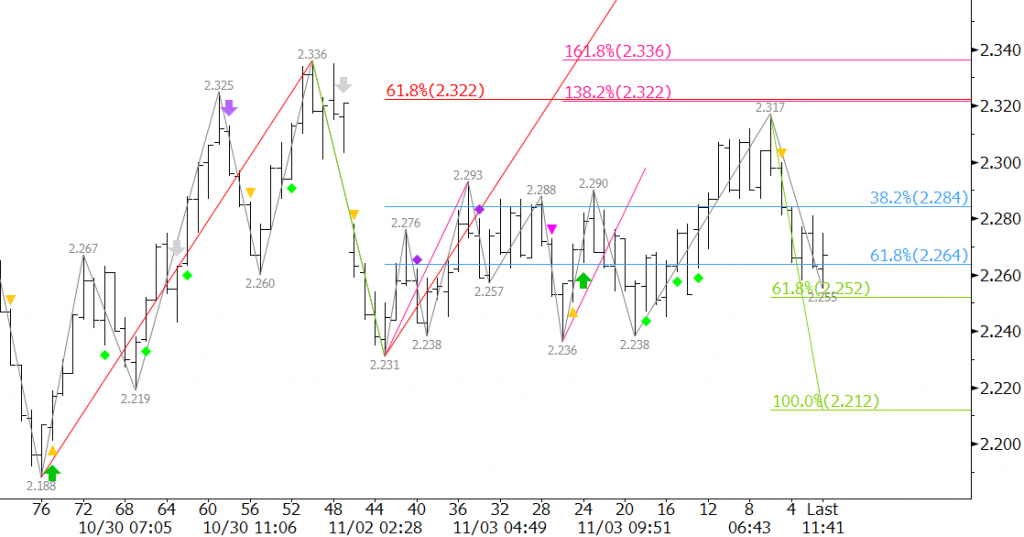
Natural gas cautiously rose to $2.317 to fulfill the smaller than (0.618) projection for the wave $2.188 – 2.336 – 2.231. Typically, a move to $2.38 would now be expected because waves that meet the 0.618 projection normally extend to at least the equal to (1.00) projection. The pullback to $2.255 is a bit worrisome, but until the $2.231 swing low is taken out odds favor of a move to $2.38. This is a crucial target because $2.38 is the 38 percent retracement from $2.78 to $2.188 and makes a connection to $2.48 where last week’s gap would be filled.

NGZ5 20151104

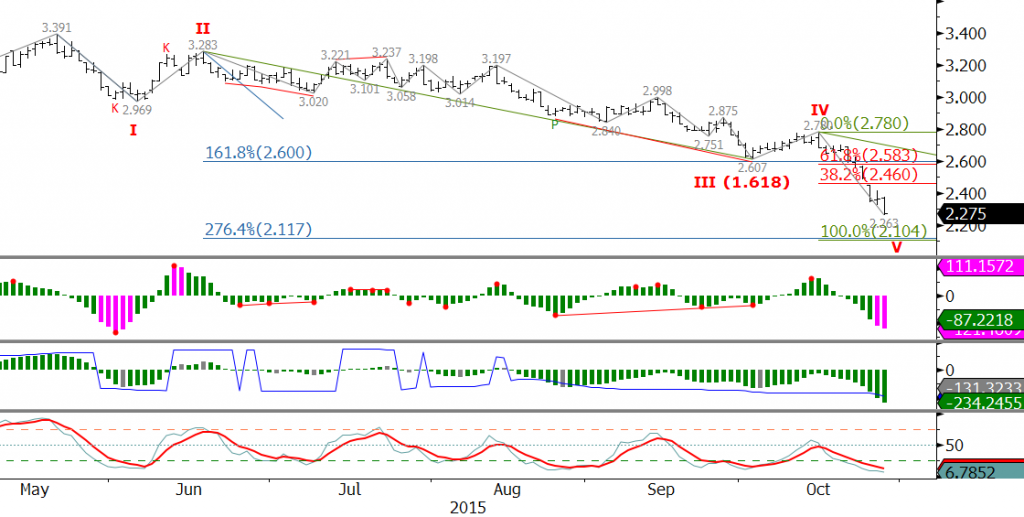
KaseX warned that the decline from $2.317 would extend (yellow triangle), and as stated, support at $2.25 is already being challenged. A move below $2.231 would take out the wave up from $2.188 and its projections to $2.38 and higher. This would in turn shift odds back in favor of a decline to $2.11 to fulfill the requirements of the textbook five wave pattern down from $3.391 as discussed last week.

This is a brief natural gas forecast ahead of tomorrow’s EIA report. Our weekly Natural Gas Commentary is a much more detailed and thorough analysis. If you are interested in learning more, please sign up for a complimentary four week trial.

By Dean Rogers

As discussed last week, everyone is looking for the natural gas bottom. I am sure no one wants me to step back onto my “picking bottoms is a dangerous game” soap box, so I will just reiterate that the best anyone can do is identify potential turning points and look to time entries and exits that fit their trading style, risk appetite, and goals.

With that in mind, let’s discuss the potential turning points for natural gas at today’s $2.263 swing low and at $2.11, the latter of which I think is the most likely point for a bottom to be made.

December’s wave structure down from $3.391 has unfolded in a five-wave pattern. We are not Elliott Wave fanatics or strict practitioners, but when a textbook pattern forms we pay attention.

Below are some of the basic Elliott Wave rules we abide by and look for when a five-wave pattern forms.

Basic Elliot Wave Rules, according to Kase:

  • A five-wave pattern is made up of three impulse waves and two corrective waves
  • Two of the three impulse waves should be equal in size
  • The impulse waves, labeled I, III, and V, should break down into five sub-waves.
  • Wave III cannot be the smallest impulse wave
  • Waves I, III, and IV should be proportional to one another (0.618, 1.00, 1.382, 1.618, etc.)

For the five-wave pattern down from $3.391 wave I met its 1.618 projection at $2.607 (end of wave III) and trend terminus (2.9693/3.3912) at $2.263 (potential end of wave V). The lowest that wave I projects is $2.12 as the 2.764 extension.

NGZ5 20151028

Given the importance of $2.263, the ticks up after the close, and oversold conditions on the KasePO, KaseCD, and slow stochastic, prices might turn higher from this level.

However, at this point there are not two equal waves. At $2.36 waves I and V were equal, but prices fell to $2.263. At $2.10 waves III and V will be equal. Therefore, based upon the basic Elliott Wave Rules, December will likely fall to the confluence point of $2.11 where wave I will have met its 2.764 projection and waves III and V will be equal.

From $2.11 we would expect to see a three-wave correction, and because of the time of year, a significant rally as the market heads into the winter heating season. A sustainable rally will be confirmed by a KasePO PeakOut, KaseCD KCDpeak, and %K over %D crossover as momentum rises out of oversold territory on the slow stochastic.

There are no guarantees that $2.11 will hold over the course of the longer-term, but this has become the most likely point at which a bottom will be made.

This is a brief natural gas forecast ahead of tomorrow’s EIA report. Our weekly Natural Gas Commentary is a much more detailed and thorough analysis. If you are interested in learning more, please sign up for a complimentary four week trial.

By Dean Rogers

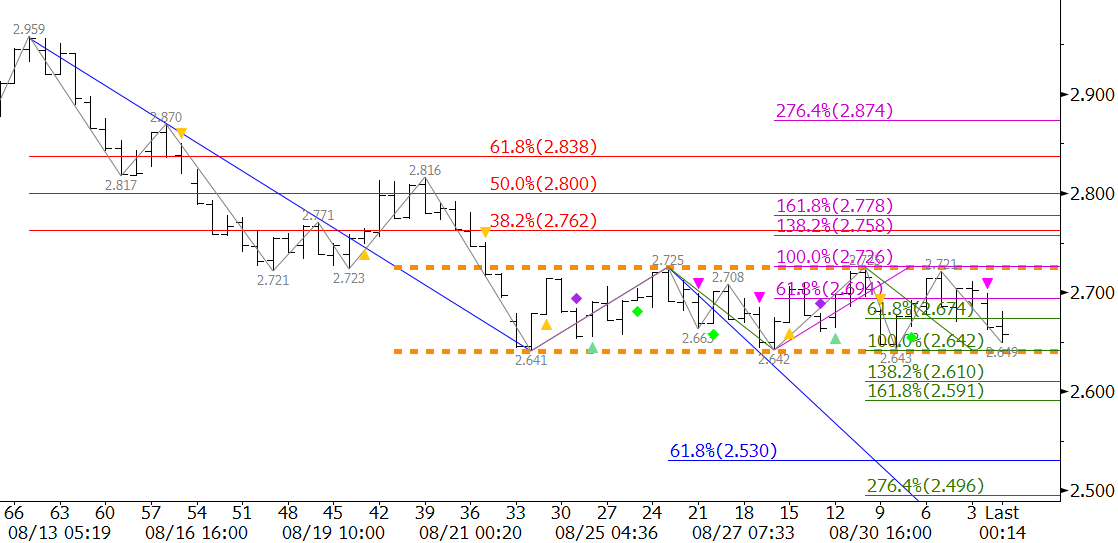
Unseasonably warm weather for early September has supported prices in the prompt month and prices were trading in a tight range between $2.64 and $2.725.

Late Wednesday afternoon October natural gas finally broke lower and a new contract low was made. In addition, the winter strip also fell to new lows again confirming the negative outlook.

Look for at least $2.59 ahead of tomorrow’s EIA storage report and possibly $2.53 before the end of the week.

natural gas

Trading will remain choppy, so another test of $2.72 and possibly $2.77 is not out of the question. We expect $2.77 to hold. A close over this would call for an extended upward correction.

This is a brief natural gas forecast ahead of tomorrow’s EIA report. Our weekly Natural Gas Commentary is a much more detailed and thorough analysis. If you are interested in learning more, please sign up for a complimentary four week trial.

Cows in a high mountain pastureBy Dean Rogers

Who could ever forget the iconic 1984 Wendy’s commercials featuring three little old ladies yelling “where’s the beef?”(If you are too young to remember treat yourself to taking a minute to watch.)

The commercials and the phrase “where’s the beef?” spawned a cultural catchphrase that has since become a statement questioning the value and substance of a product. The value of beef, priced in live cattle futures, has tripled since 1984, but a downturn in prices over the past 10 months begs the question, “where’s the beef going?”

On October 31, 2014 the perpetual (first nearby) live cattle futures contract rose to an all-time high of 171.975 cents per pound. Since then, prices have fallen in a corrective manner and recently came very close to meeting major support at 141.35. This is a highly confluent target that serves as a series of Fibonacci projections for the waves down from 171.975 (blue), 164.25 (green), and 156.475 (red) as shown in the chart below.
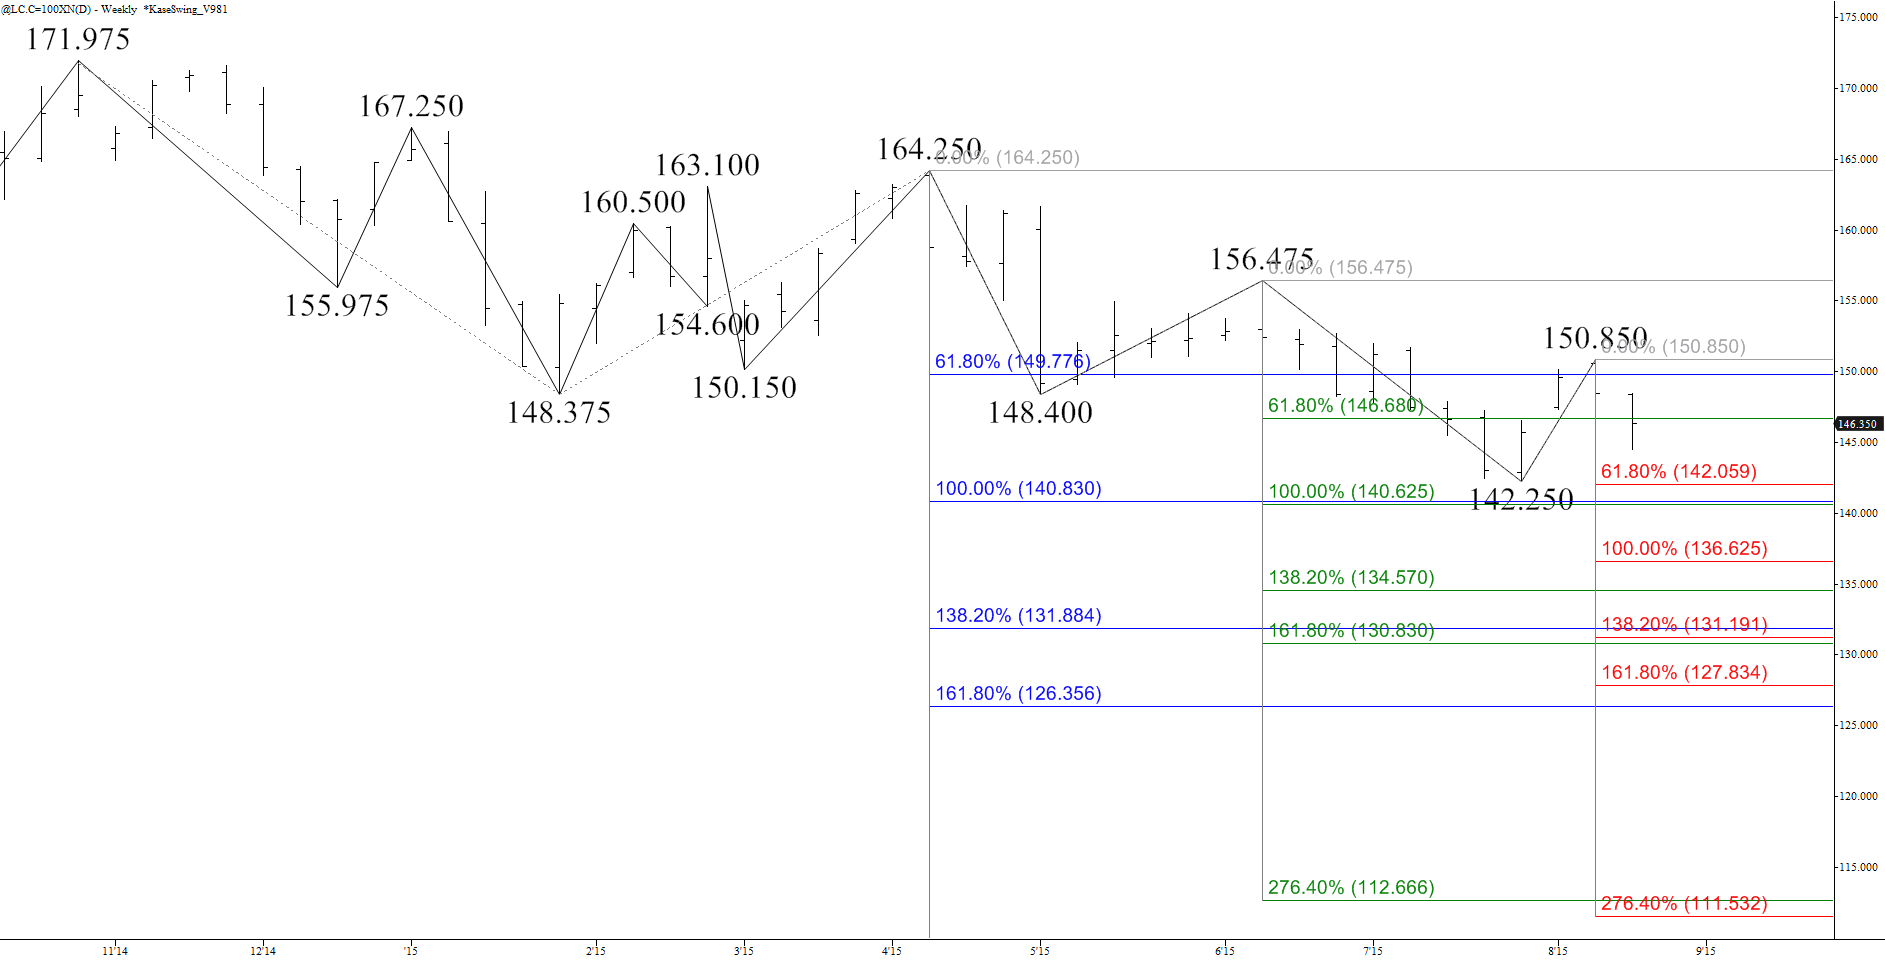
live cattle support

A close below 141.35 would open the way for the decline to continue to at least 135.6 and very likely 131.4. The latter is another highly confluent wave projection and potential stalling point, but the key target for live cattle futures is 127.0. This is the 1.618 projection of the largest and most important wave down from 171.975 (blue) and the more recent wave from 156.475 (red).

The decline from 171.975 is no doubt a correction of the long-term move up, and corrections normally hold the 1.618 target. Therefore, we expect to see a significant pullback and potential bottom form at 127.0. However, a sustained close below this would open the way for an extended decline to 122.05 and possibly 112.0.

The decline has stalled at 142.25 for now, and so far the subsequent rise to 150.85 is most likely a small correction of the move down (yes we are talking about corrections of corrections). The recent move up is most likely being driven by a typical seasonal boost for beef ahead of Labor Day.

The upward correction may extend, but 153.4, the 1.00 projection of the wave up from 142.25 (pink) and the 38 percent retracement of the decline from 171.975 should hold. The connection to 153.4 is made through the 0.618 projection of 149.8.
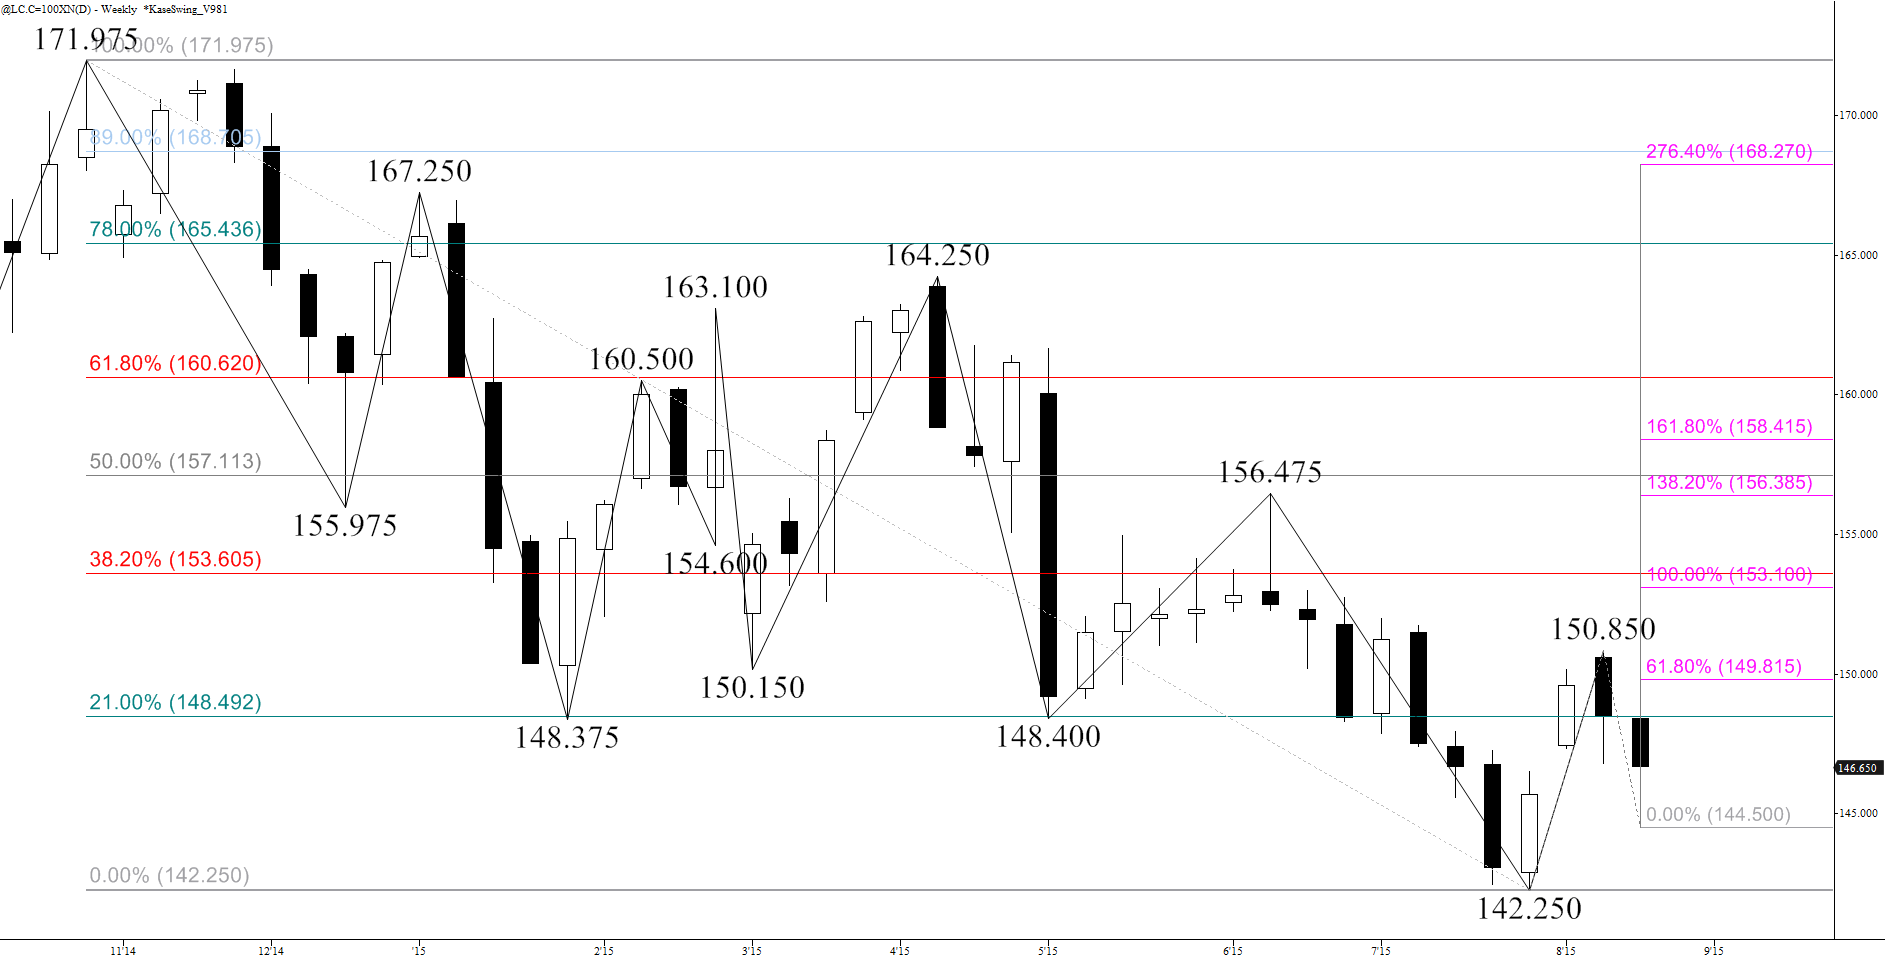
live cattle resistance

Based upon most technical factors as of this analysis, we don’t expect to see prices rise much higher than 153.4. This is a very important level not only because it is a confluent retracement and wave projection, but it also protects the 156.475 swing high. A move above 156.475 would take out of the waves down from this swing high and from 164.25. As a result the likelihood of a decline to or below 141.35 would be significantly dampened.

Therefore, upon a close over 153.4 odds would shift in favor of an extended upward correction to 156.8 and likely 159.5, a crucial target because it is split between the 1.618 projection of the wave up from 142.25 and the 62 percent retracement of the decline from 171.975. A sustained close over 159.5 would indicate the decline from 171.975 is over and would call for 168.5 and higher.

So to answer the question “where’s the beef going?”; technical factors show that prices will most likely fall once the Labor Day demand boost passes. Look for resistance at 153.4 to hold and for 141.35 to be challenged again. A close below 141.35 will call for 135.6, 131.4, and 127.0.

Check out Kase on Technical Analysis to learn more about trading and forecasting price using technical analysis.

Charts created using TradeStation. ©TradeStation Technologies, Inc. 2001-2015. All rights reserved. No investment or trading advice, recommendation or opinions are being given or intended.

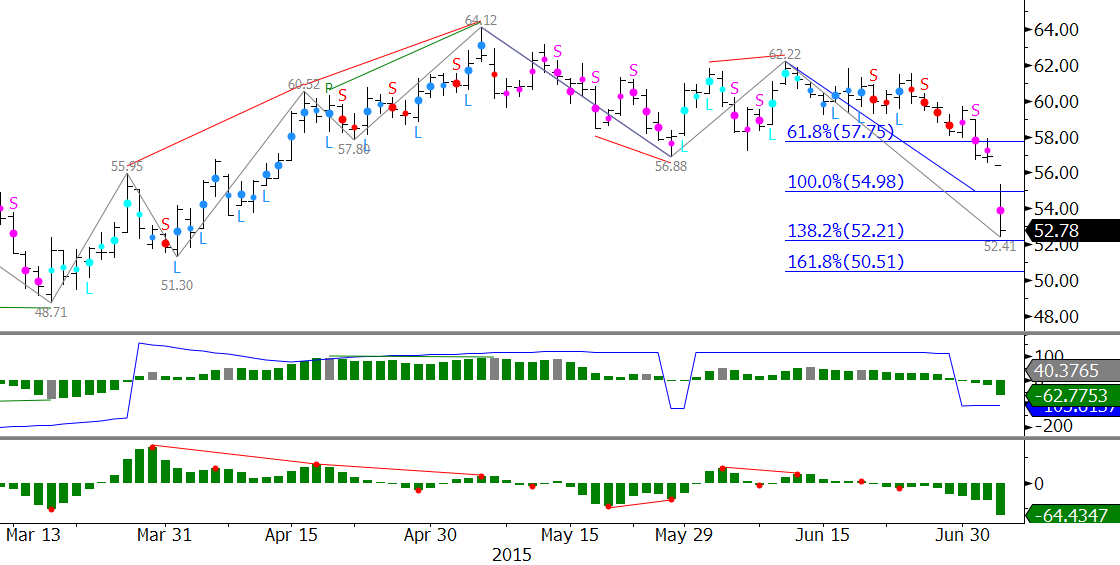
As predicted WTI crude oil has broken lower out of the recent trading range and fell by nearly eight percent on Monday. The important 1.382 projection was met at the $52.41 swing low. Key support at $50.5 should be tested tomorrow. We consider this a decision point for a much more bearish outlook and decline into the mid-$40’s. Today’s action may even dust up talks about the $30s again, though we think that conversation is a bit premature. Look for resistance at Monday’s $54.4 midpoint. This may be tested in early trading Tuesday, but should hold.

wti crude oil

This is a brief analysis and outlook for the near-term. Our weekly Crude Oil Commentary is a much more detailed and thorough energy price forecast. If you are interested, please sign up for a complimentary four week trial.

This is an important time for natural gas because the market is moving out of the spring shoulder months and into summer. The market had been poised to test the contract lows, which it did, but the lows held and prices reversed higher this week.

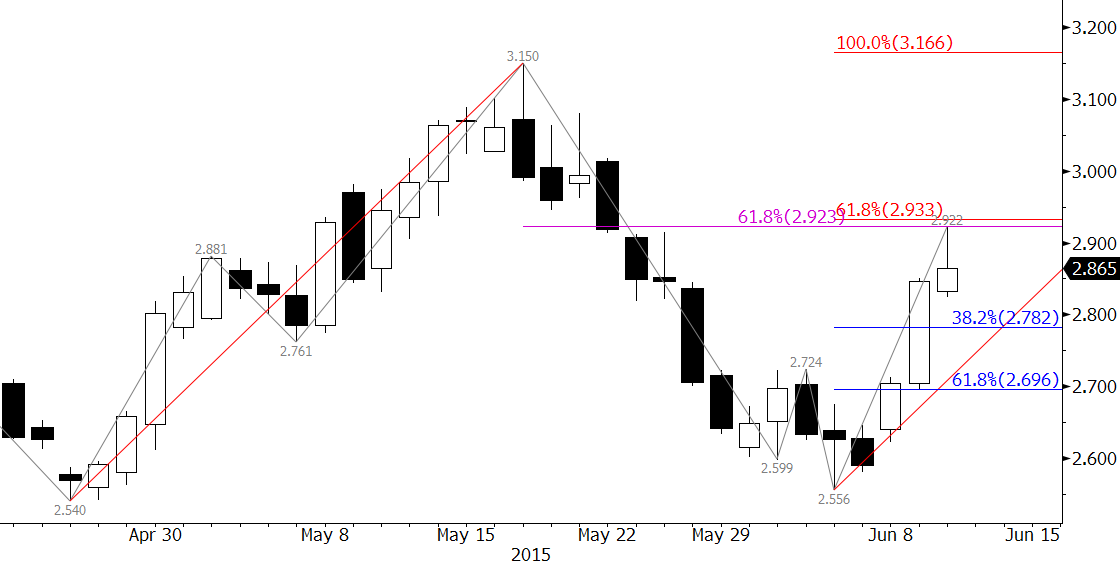
The July natural gas futures contract closed above $2.78 resistance on Tuesday and was driven by warmer temperatures in much of the eastern half of the U.S. To sustain the move warm weather will need to persist and key resistance at $2.92 must be overcome on a sustained closing basis. The market tested $2.92 in early trading Wednesday, but this level has held on a closing basis so far.

natural gas forecast

The $2.92 target is the gateway for a sustained summer rally because it is currently the most confluent target on the chart and makes connections to targets near, and well above, July’s $3.15 swing high. It the 62 percent retracement from $3.15 and the 0.168 projection for the move up from $2.54. A close over $2.92 will call for July’s $3.15 swing high to be challenged because the 1.00 projection for the wave up from $2.54 is $3.166.

The $2.92 level will probably be overcome in early trading tomorrow on an intraday basis, but again, the key will be a sustained close over $2.92. In fact, if there is another bearish EIA storage report tomorrow, the move up could stall.

First support is near yesterday’s $2.77 candlestick midpoint and the 38 percent retracement of the move up from $2.556. If the outlook is going to remain positive for at least the next few weeks then $2.77 should hold. Key support is $2.70, the 62 percent retracement. A close below this would put the market back into a cycle of testing the contract lows again.

This is a brief analysis ahead of tomorrow’s EIA report. Our weekly Natural Gas Commentary is a much more detailed and thorough analysis. If you are interested, please sign up for a complimentary four week trial.

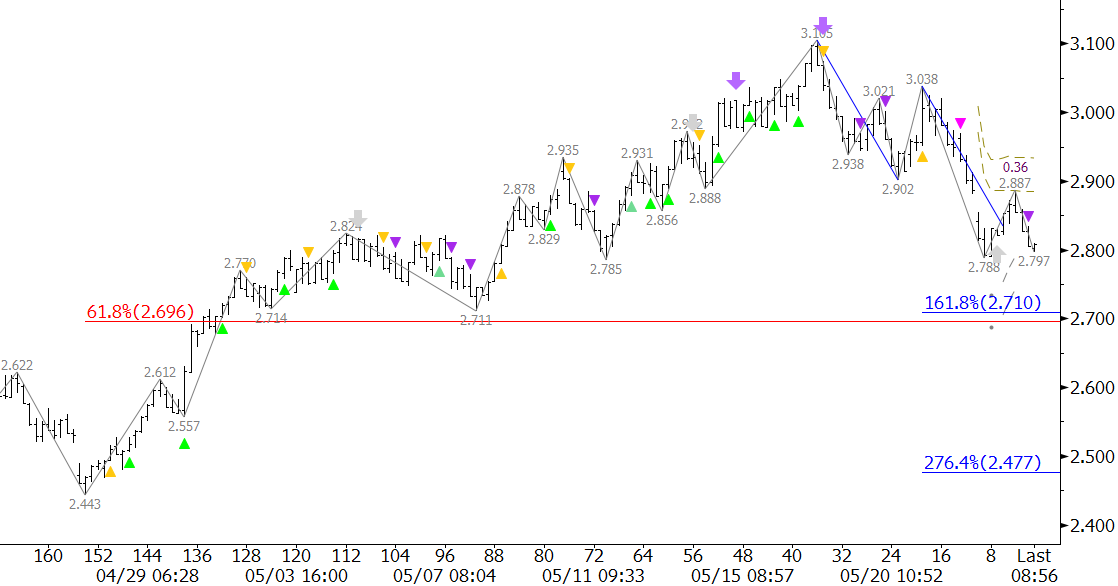
Natural gas’ pullback still appears to be corrective, but has positioned itself to test a crucial decision point at $2.71. This is in-line with the $2.711 swing low, the 1.618 projection of the wave down from $3.105, and the 61.8 percent retracement of the move up from $2.443.

natural gas

The $2.71 objective should be challenged ahead of tomorrow’s EIA report, which is confirmed by KaseX’s short signals on the $0.035 KaseBar chart today. The confluence, positioning, and importance of $2.71 leads us to believe that it will hold, at least initially, and will be followed by a trading range similar to the one seen throughout March.

This is a brief analysis ahead of tomorrow’s EIA report. Our weekly Natural Gas Commentary is a much more detailed and thorough natural gas forecast. If you are interested, please sign up for a complimentary four week trial.

Natural gas had been supported by late winter weather in regions of the U.S. through late last week. However, as expected, natural gas prices finally broke lower out of the large scale corrective pattern that formed during the calendar month of March. The move down is poised to continue, but in the very short term, there may be a small pullback first.

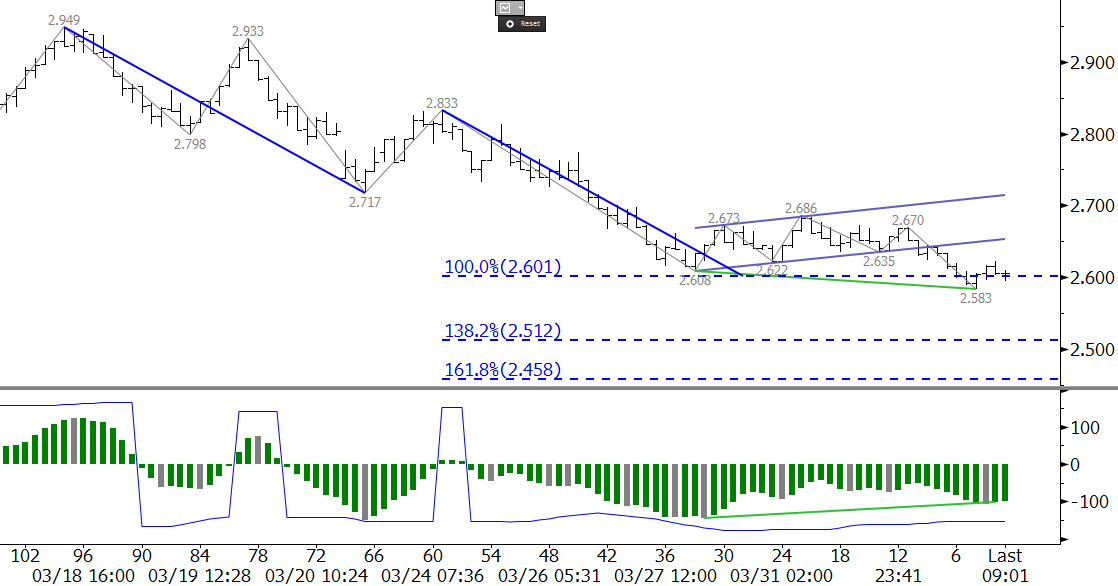
The May futures contract broke out of another small bearish flag this morning on the 240-minute equivalent Kase Bar chart and fell to a new contract low of $2.583. This is an important area of support, and a potential short term stalling point because May’s $2.583 low is in line with the 1.00 target for the move down from $2.949 (as shown in the chart above), and is also near the continuation chart’s swing lows of $2.567 and $2.578. In addition, a bullish KasePO divergence (green trend line) was confirmed this morning.

Natural Gas Prices

All of these factors are positive for the very short term. They indicate that a pullback may take place ahead of tomorrow’s U.S. Energy Information Administration (EIA) Natural Gas Weekly Update. However, the longer-term technical and fundamental factors indicate resistance should hold and that the move down will extend. Once natural gas prices have definitively broken support between $2.57 and $2.60, look for $2.51 and $2.46, the latter of which is also the 0.618 projection of the compound wave $2.949 – 2.608 – 2.686.

Look for resistance at $2.65 to hold. This is the 21 percent retracement of the decline from $2.949 and is near the lower trend line of the small bearish flag that broke lower this morning. Even a pullback to $2.72, which is the 38 percent retracement, would be considered a normal correction. A close over $2.72 is doubtful without a bullish surprise from external factors.


Take a trial of Kase’s more in-depth weekly energy forecasts.

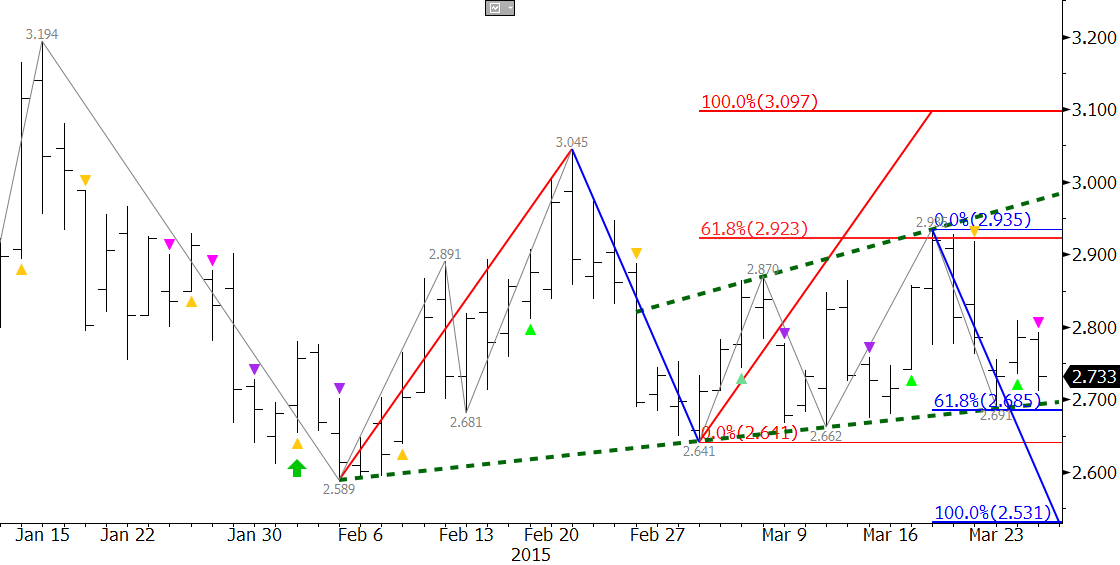
Natural gas prices are still oscillating in the upward sloping range that began March 3 when the $2.641 swing low was made. The lower trend line of the formation, which connects back to the $2.589 contract low, was tested, but held again on Monday. Most pundits indicate the long-term fundamentals are bearish, but this begs the questions, why hasn’t the market broken lower yet? This is one of many areas that technical analysis can help answer that question and give us a good idea of where the market will go once it breaks out of this range.

The chart below tells us everything we need to know about the outlook for natural gas in the near term, and can give us an idea about the longer-term outlook too. This is a very short-term analysis, so we will focus on those factors. Technical factors are showing that the market does agree with the bearish fundamentals, and that a break lower should take place soon, but that there are still enough positive factors like late winter weather in the Northeast to support prices for now.

Natural Gas Forecast

The range that has formed over the past few weeks is an expanding wedge (shown in green), and a break out of this pattern will solidify direction for natural gas prices. The break out points for the pattern at $2.69 and $2.94 are in line with the 0.618 projections for the wave up from $2.589 (show in in red) and down from $3.045 (shown in blue). The confluence of these points tells us that a close below $2.69 would open the way for the 1.00 projection of $2.53, and a close over $2.94 would call for an extended correction to $3.10.

The expanding wedge and the Fibonacci wave projections give us a solid forecast once the market breaks out of the wedge. The wedge is a corrective pattern, and because the market entered the pattern after declining from $3.045, a break lower out of the wedge is favored. The negative bias is also confirmed by the KaseX’s most recent yellow and pink down triangles.

In summary, the near-term outlook is negative and a bearish U.S. Energy Information Administration (EIA) Natural Gas Weekly Update tomorrow would likely be the catalyst to achieve the expected break lower out of the expanding wedge. A close below $2.69 will confirm the break lower and call for at least $2.53. Conversely, a close over $2.94 would call for an extended correction to $3.10.

Take a trial of Kase’s in-depth weekly Natural Gas Forecast.

Take a trial of the KaseX trading indicator.

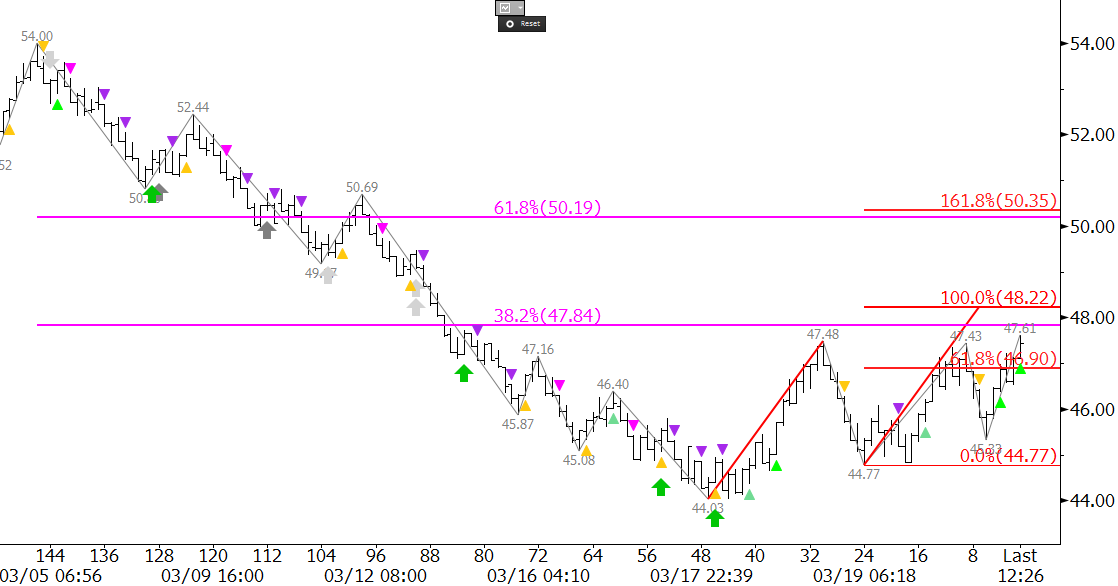
WTI crude oil rose for a second straight day due to the declining dollar. The long-term bias is still negative, so the move up is corrective. However, mixed fundamental and technical factors indicate the correction should extend to at least $48.2 before settling into another trading range. This is the 1.00 projection for the wave up from $44.03 and the 38 percent retracement of the decline from $54.0. A close over $48.2 would call for $50.4, the 1.618 projection and the 62 percent retracement. Look for immediate support at the $45.33 and $44.77 swing lows.

Take a trial of Kase’s weekly energy forecasts.

WTI Crude Oil