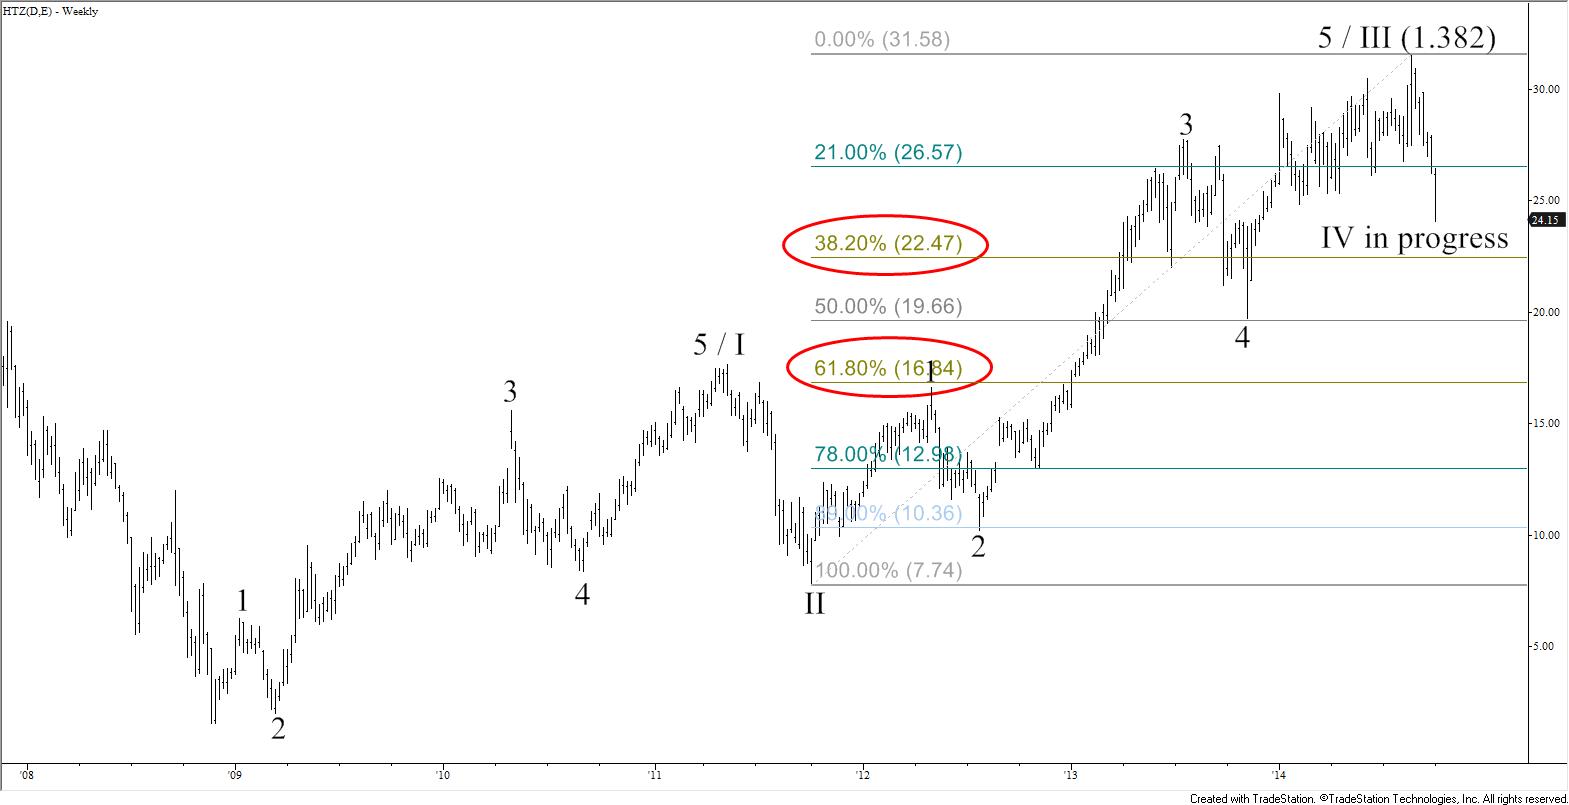
On October 1, 2014, Kase commented on a tweet, and posted the weekly chart shown below, regarding the decline of Hertz (HTZ). In that tweet, we stated that the decline from $31.61 was likely a corrective Wave IV of a long-term bullish five-wave formation. A week later, on October 8, we discussed the trade setup during our weekly chat session (minutes 16:50 – 21:00). At that point, the 38 percent retracement at $22.47 had been taken out, but we stated that for the five-wave formation to remain intact, the top of Wave I ($17.64), which was in line with the 62 percent retracement at $16.84, would need to hold. We also commented that we were watching the daily chart for bullish signals such as completed momentum divergences and oversold signals that would tell us the move down was possibly complete.
Figure 1 – HTZ Weekly as of October 1, 2014
Fast-forward a few weeks later, and the next chart below shows that the move down stalled at $18.50 on October 15. The $18.50 swing low held the 62 percent retracement and top of Wave I as called for. A recovery has begun to take place, indicating Wave IV is likely complete and Wave V is underway. In addition, Wave IV ended up being a simple correction versus the Wave II correction. If you look closely at the details of Wave II you will see that it broke down into a complex five-wave, or nested three-wave correction. This is called the “rule of alternation”, which indicates one of the corrections will be complex and the other simple when a five-wave pattern is forming.
Figure 2 – HTZ Weekly as of October 28, 2014
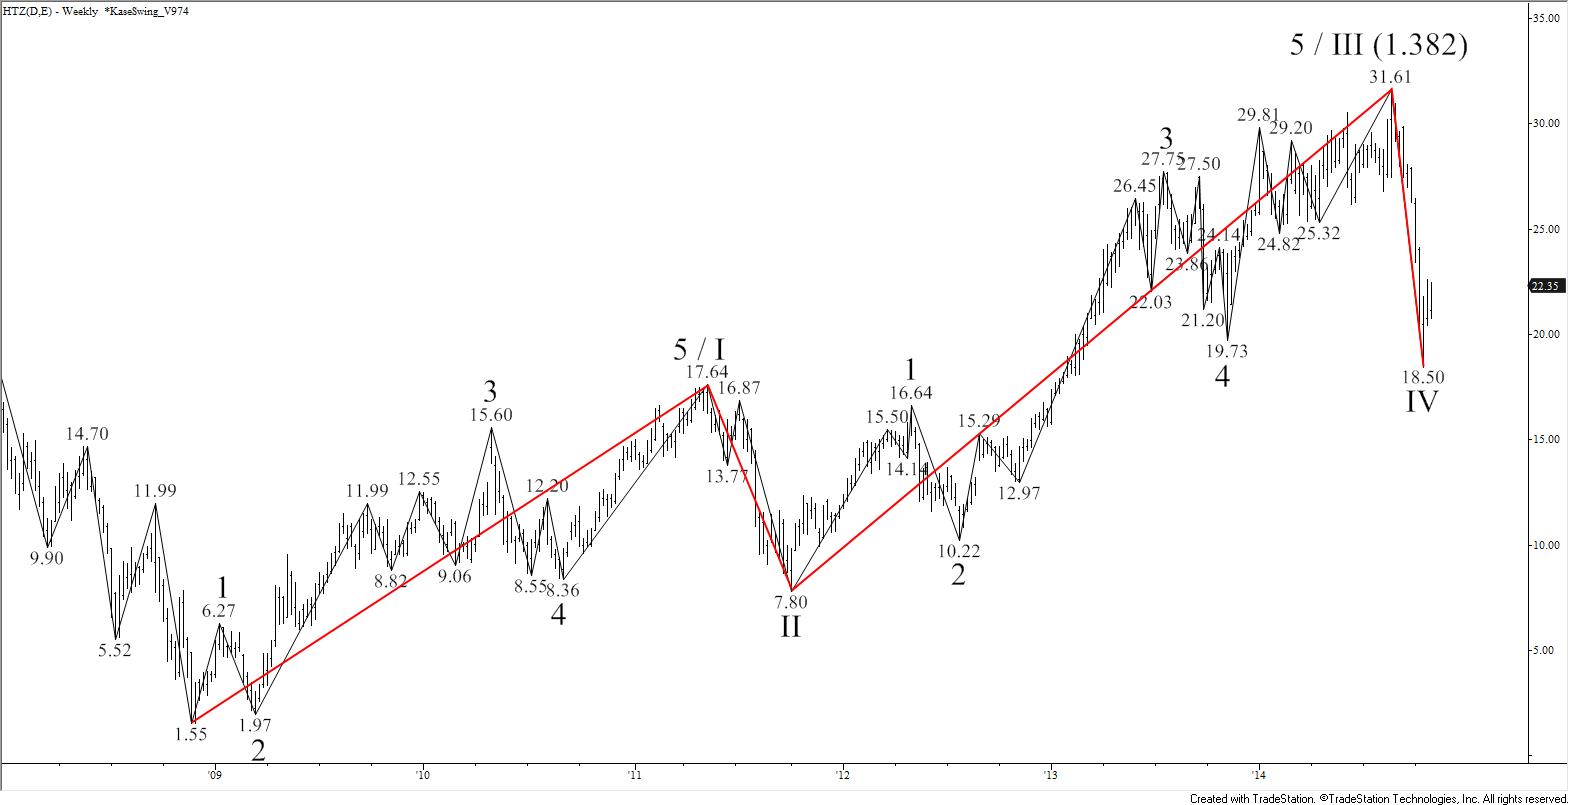

Wave III met the intermediate (I, or 1.382) projection of Wave I, $1.55 – 17.64 – 7.80. This formation now has the potential to extend to $33.5 over the course of the longer-term (a few months or more). This is because Wave I projects to $33.5 as the larger than target (L, or 1.618). This is also the smaller than (S, or 0.618) projection for Wave III, $7.80 – 31.61 – 18.5. Most importantly, for this to be a textbook five-wave formation, at least two waves have to be equal. Rising to $33.5 would make Waves I and V nearly equal in size (Wave I = 17.64 – 1.55 = 16.09, Wave V = 33.5 – 18.5 = 15.0). If Waves III and V end up being equal, the move up would extend to $42.3. So over the course of the longer-term, as the probable Wave V extends, we now know that the potential for this move is $33.5 and possibly $42.3.
As we had discussed in our weekly chat session on October 8, once Wave IV was complete, we wanted to drop down to time a long entry on the daily chart. However, we needed to see evidence on the daily chart that the move down was likely complete. When dropping to the daily chart shown below, as of October 28, we can see that a bullish KaseCD divergence (red line) and KasePO PeakOut (green P) were confirmed at the $18.50 swing low, and that two subsequent buy signals (green and blue L) triggered. These are signals from our Kase StatWare indicator package and show that a trader may have established a long trade on the daily chart upon the second L (marked by the blue arrow) on October 20 at approximately $21.39. A stop would be placed at $19.07, which is DevStop3, or approximately 3.6 standard deviations of average True Range (ATR).
Figure 3 – HTZ Daily with Kase StatWare as of October 28, 2014
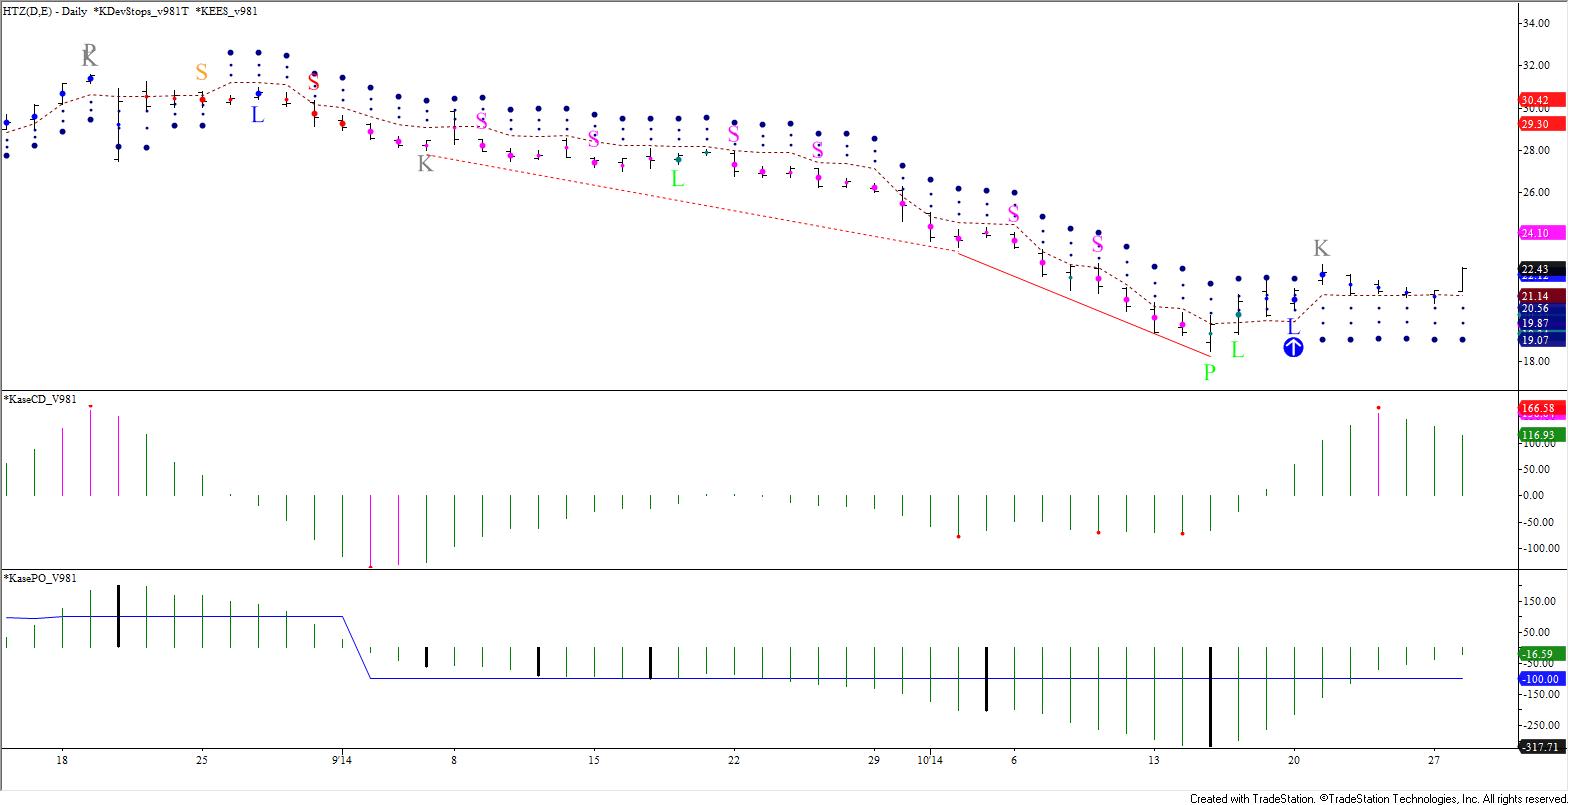
Traders holding this long position would now monitor the daily chart for exit and warning signals. One such warning signal was triggered by the gray K, which is a weak KCDpeak. Traders may have pulled stops into DevStop2 (second blue dot), and once the accompanying $22.60 swing high is overcome, the stop will be widened back to Dev3 (third, and largest, blue dot).
In addition to monitoring the daily chart, traders could also watch for a confirmed buy signal (L) on the weekly chart. This has not triggered yet, but once a buy signal forms on the weekly chart, a trader could scale the daily trade to the weekly chart, widen stops to DevStop3 on the weekly chart, and then monitor the weekly chart for exit and warning signals. The long signal on the weekly chart will warrant the added risk of holding a trade with wider stops on the weekly chart. This ‘scale up’ technique is useful for holding positions over longer periods of time and avoiding whipsaws. This technique also limits initial trade risk because the standard deviations of ATR (method used for Kase’s DevStops) on the daily chart are smaller than standard deviations of ATR on the weekly chart. Therefore, if the trade does not play out as expected, a trader can get out of the trade sooner on the daily chart, limit losses or preserve any gains, and live to trade another day.
At this point, we can also analyze the recent move up from $18.50 and look for important near-term resistance. When forecasting, we primarily rely upon confluence of Fibonacci wave projections and retracements. For instance, the smaller than (S or 0.618) projection for Wave 1/V, $18.5 – 22.6 – 20.77, shown in the chart and table below, is $23.5. This is confluent with the 38 percent retracement from $31.61 to $18.5 (magenta line). This then connects to $24.7 as the equal to (E, or 1.00) projection, which is near the 50 percent retracement. The intermediate target (I, or 1.382), is $26.6. This is also the crucial 62 percent retracement. Therefore, the wave projections for Wave 1/V, and the retracements of the decline from $31.61 to $18.5, show a cascade of targets that connect to one another.
Figure 4 – HTZ Daily with Retracements as of October 28, 2014
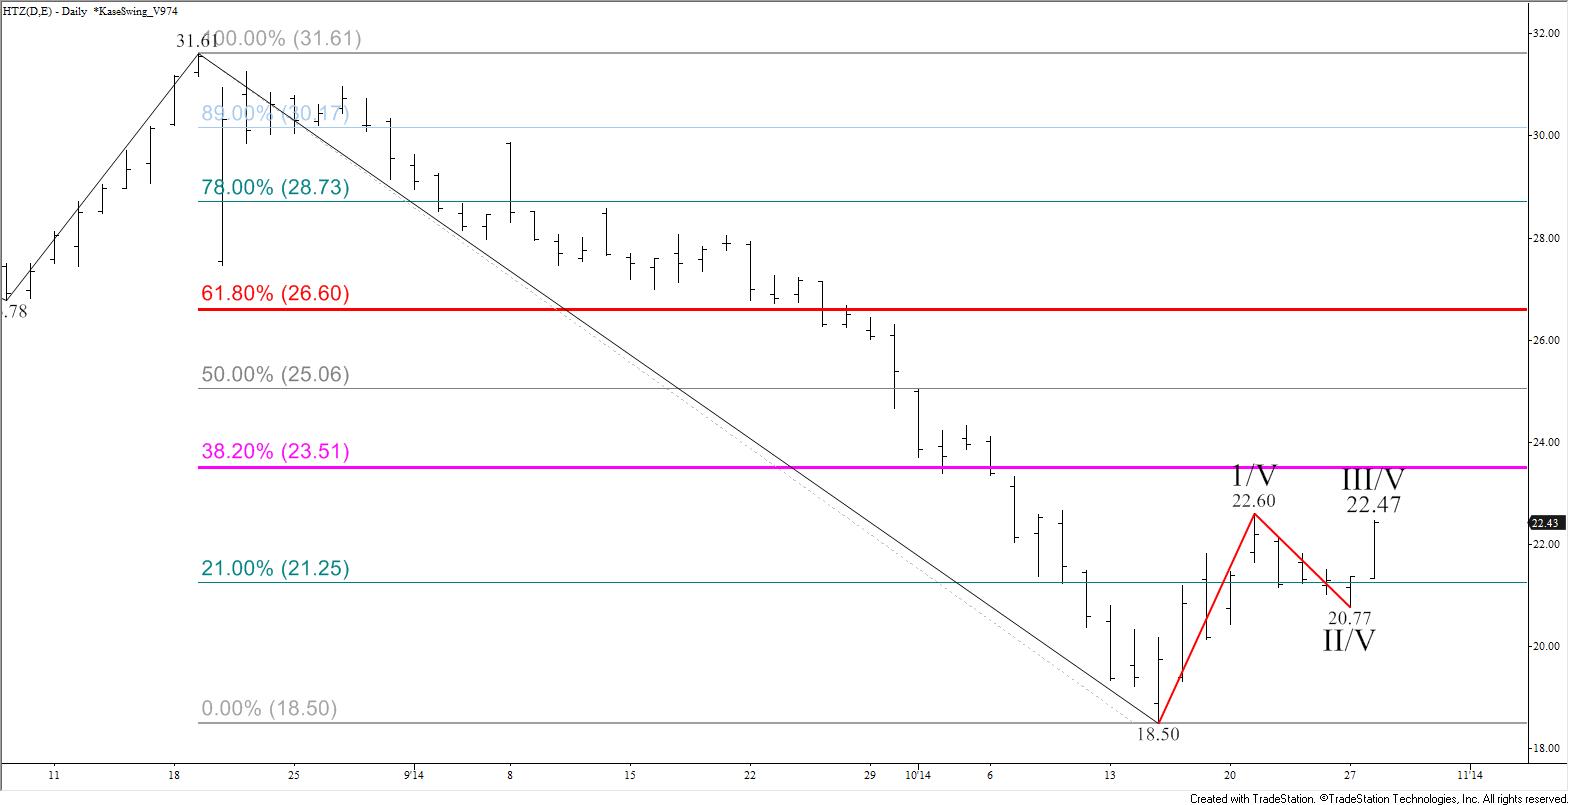

What this indicates, is that $23.5 is an important near term resistance level. Currently, the move up from $18.5 is corrective of the move down from $31.61. Generally, a normal, profit taking correction, will hold the 38 percent retracement. However, because this is also the smaller than target, our studies show that meeting $23.5 will open the way for an extension to at least $24.7, the equal to target. A close over $24.7 would then call for $26.6, which is the key threshold for a bullish long-term outlook. This is because $26.6 is the 62 percent retracement and connects to $33.5 as the trend terminus. As discussed earlier, $33.5 is the larger than target for Wave I, and would make Waves I and V equal. Therefore, when all is said and done, the connection to $33.5, and completing the five wave pattern, is made through $23.5.
This analysis does not mean that HTZ will absolutely rise to $33.5. The move up may prove to be corrective, stall, and continue to decline. However, based upon the factors discussed above, the potential for $33.5 is present. The forecast is a road map for the near-term, and the StatWare indicators are the vehicle used to navigate the turns in the road. Each of the targets discussed is a potential stalling point for the move up, and levels at which traders holding a long position will want to closely monitor for exit and warning signals generated by their indicators, like divergences, PeakOuts, and KCDpeaks. If these types of signals trigger, then profit will be taken. Otherwise, the long trade will be ridden higher, possibly scaled to the weekly chart upon confirming buy (L) signals, and ultimately exited when an exit signal triggers on that chart.
These are just a few of Kase’s trading and forecasting techniques that can help make you a better, and more informed, trader. If you would like to learn more, join us for our free weekly educational chat sessions, take a trial of our trading indicators, and if you are an energy trader, take a trial of our weekly crude oil and/or natural gas forecasts.

 By
By 