Today’s Leading Women – Episode 634: Learn Trading and Forecasting Techniques with Cynthia Kase

Kase’s president Cynthia A. Kase is featured in a podcast interview with Marie Grace Berg of Today’s Leading Women.

Listen to Ms. Kase’s interview on iTunes and give it a rating, or click the link below to listen on the Today’s Leading Women website.

Episode 634: Learn Trading and Forecasting Techniques with Cynthia Kase

Cynthia-Kase-of-Kase-Company-e1447283745788


coffee1

Read on TraderPlanet

by Cynthia A. Kase

Iced Coffee Anyone?

Just keeping up with the news, coffee should enter a lower priced environment, longer-term. In the short-run, technicals indicate an expectation of prices testing a threshold at 110 would not be unreasonable.

Coffee Production Forecast

Economists see much room for increased production out of Africa, which used to be the planet’s biggest crop exporter, producing 25 percent of the world’s coffee. After many years of state interference in, and regulation of agriculture, coffee production per acre is so low that it could fairly easily be increased by a factor of five. Simple changes have already increased output per tree by 50 percent in some areas. Incubator commodity firms are proving increases are practical. So, more supply means eventual lower prices.

Near-term Coffee Technical Indicators

We’ve been bearish technically on coffee since our previous article that focused on the September contract, June 23 Will the Sun Shine on KC. We expected coffee to break down out of its correction, first to 123.2 and then to at least 117.50. 141 was resistance. KCU15 dropped to 123.65, rose to 139, coming within 2 cents of our level, then hit 117.5 exactly before meandering down to 113.05.

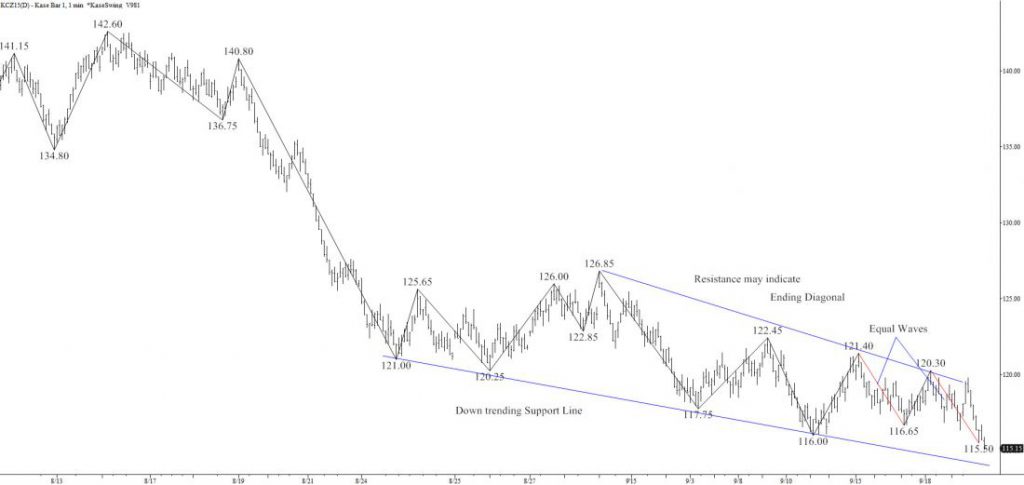
Given coffee’s back in the news, let’s look at the December contract. The chart patterns are unrelievedly negative on the daily chart and above. The intraday chart been bouncing along a downwardly sloping trend line. The market is attempting to skid to a halt, or at least a stall. The pattern intersects the y-axis at about 114.6. This is highly confluent, major support, as 114.6 is the smallest (0.62) extension for the wave down from 207.8, as well as, both extension targets and corrective projections for more recent waves. It’s also the endpoint of a rare ending diagonal triangle.

Coffee Outlook

I think 114.6 will break, even if there’s a bounce. The 122 – 125 area must be solidly overcome for a recovery to begin. On a slip below 114.6, I’d look for 110.6. One reason 114.6 will probably break is that the first of the two equal waves shown in red targets 112.7 as its 1.62 extension, showing no support at 114.6.

There might be a test of and small bounce after 112.7, which is “sandwiched” between 114.6 and 110.6 within the wave structure. So the three prices are connected making it more probable for the lower number to be met on a break through 114.6. Given that KCZ15 is making new contract lows, there’s not many numeric methods, aside from the waves to confirm the values discussed, though the daily warning line on Kase’s stops is 114.6.

Unlike September, this contract has no support around 100.0. There’s big gap in the targets from 110.6 to 98.6. That means coffee wants to stay at least in the teens, and may move into a corrective phase into the 130s. So, I’d stay short, or day-trade short, but there might not be enough downside here for a longer lived position. Watch 110.6, and don’t crunch your ice.

Coffee2


Charts created using TradeStation. ©TradeStation Technologies, Inc. 2001-2015. All rights reserved. No investment or trading advice, recommendation or opinions are being given or intended.


Send questions for next week to askkase@kaseco.com, and click the link learn more about the KasePO, KaseCD, KEES, and the Kase DevStops.

Mon1By Cynthia A. Kase

Read on TraderPlanet.com

Six big firms dominate the agricultural supply business today, having bought up over 200 smaller companies and their intellectual property over the past 25 years or so. Monsanto, the world’s largest seed supplier, and BASF both reportedly tried to buy rival Syngenta. Though no deals went through, it looks like the industry is in for another round of consolidation. One of Monsanto’s problems is that weeds are becoming resistant to its star product, Roundup, and commodity prices are down, reducing farmers’ ability to pay for its goods. A merger would help by giving it economies of scale which could improve its both prices and its pace of innovation.

The Monsanto stock price itself is now about 30 percent off its post-recession $128.79 high. Is Monsanto stock in the weeds or will it round UP?

Analysis

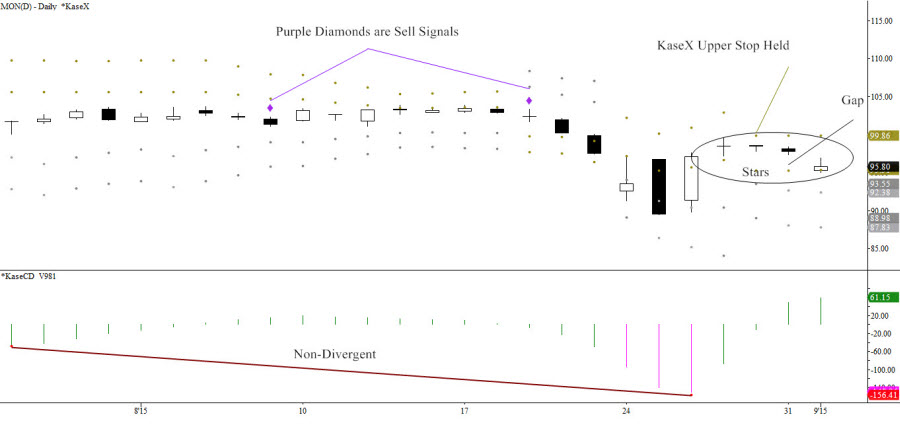
I’m biased to the downside primarily for these bearish reasons. The last four days, following last Wednesday’s big up day, have been stars, or small open-close range days. There was a possible breakaway gap down this morning. Kase’s daily upper stop has held. Momentum is non-divergent. The two most recent signals on KaseX, purple diamonds, were sell signals. All these are shown in the chart below.

mon2


Charts created using TradeStation. ©TradeStation Technologies, Inc. 2001-2015. All rights reserved. No investment or trading advice, recommendation or opinions are being given or intended.

If the $10 recovery lengthens, it’s no big deal if $98 is tested. The price to watch is $101. There’d have to be a three sigma move of the daily double TrueRange for $101 to be hit. This is also the minimum, 0.62 extension for the bounce from $89.34 to $99.48, and the midpoint of the candlestick for the week ending August 7. Above this, there’s heavy resistance in the $105 to $107 area, but odds then swing in favor of a recovery right back to May’s highs of $123 plus.

The decline to $89.34 was about $0.75 shy of $88.6 support, which must be clearly broken for a continuation lower. $88.6 is the 1.62 extension for the major recent wave is 128.79 – 105.76 – 126.0, and the 1.38 extension for the first wave down from $123.82. The trend terminus for both these waves is $71.25. Importantly, the correction from $89.34 to $99.48 targets $88.6 as the Phi-cubed projection. $88.6 is Kase daily DevStop2 and weekly DevStop1, so it is confluent statistically.

It’s not unusual for trending patterns elongate in such a way as to stretch key targets to more extreme levels. This is what’s happened for Monsanto. After falling from $128.79 to $105.76 in 2014, prices recovered to $126 earlier this year. Waves down from $126 have pushed the major downside target to$86.7. This is the “trend terminus” for the wave from $126.0 to $111.16, and the 1.0 extension from $126.0 to $103.14. Very importantly, $86.7 is the 50 percent retracement of the entire move up from the recession low of $44.61.

Outlook

Structurally, there’s a reasonable chance for $86.7 holding support, otherwise, I’d look for a free fall to $71.25. Below that don’t get lost after landing in the weeds!

Send questions for next week to askkase@kaseco.com, and click the link learn more about KaseX and the Kase DevStops.

hogsby Cynthia A. Kase

Read on TraderPlanet.com

After last year’s viral outbreak that killed millions of hogs, pork production, now having recovered, looks to set records and overshoot demand. Apparently some commodity advisors are panicking and recommending that their producer clients use lean hog futures to hedge and avoid even lower prices. Is this a good idea?

To our view, hedging hogs today would be like closing the sty door after the pig has fled. In Kase’s energy practice, producers hedge when markets are enjoying high prices, not when already painfully low. At this point, defensive measures are called for.

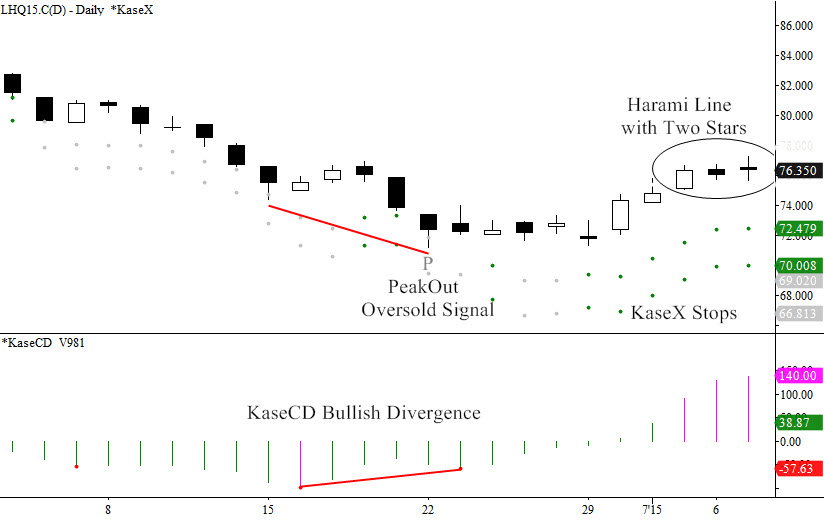
The reason I’d be a reluctant outright seller or short hedger is that prices have been rising over the past few weeks, not falling. Looking at the August 2015 contract, prices fell from a 95.35 high last November to a 71.175 low June 22. Then the KasePO and KaseCD momentum indicators generated bullish oversold and momentum divergence signals. A 71.275 swing low followed, forming a classic “W” shape, or double bottom.
lean hogs

Last week’s candlestick completed a classic bullish morning star. However, the pattern remains unconfirmed until a close over 76.65, dampening the bullish tone. Also, the daily chart shows a potentially negative Harami line with two stars.

While the overall structure is down, the current 6 cent bounce could continue to 79 and maybe 81.5. A close over 81.5 hasn’t high odds right now, but if it happens we could see another 10 cents. 79 is the 2*1.38 extension and Phi2 corrective projection for 71.175 – 74.05 – 71.275. For the final wave up spanning from July 2 to July 7, 75.175 – 77.275 – 75.625, 79 is the 1.62 extension and 81.5 is both the trend terminus (77.2753/75.1752), and 2*1.38 extension.

If there isn’t a close over 76.65 soon, the rally might fail. A close below June 2s open, 75.15, followed by 72.4 would be cause for concern. A close below 70 could send lean hog prices squealing – potentially to 55 cents as, from a technical standpoint, targets ranging from 67 down to 55 have similar odds.

72.4 and 70 are KaseX stops. The key wave, 95.35 – 86.00 – 90.65, targets 70 as the important 1.62 extension. The last down wave, 77.275 – 75.625 – 76.625 targets 72.4 as the trend terminus (77.2753/75.6252), 2*1.38 extension and Phi3 corrective projection.

Here’s my hedging strategy. If you’re ok with “getting called”, sell calls above the market, maybe just above 81.5, perhaps purchasing puts on the downside with the funds depending on your risk appetite and whether you need to qualify for hedge accounting. Otherwise wait for a drop below 75.15 or so, then scale-in short calls maybe five cents or so above the market, again possibly buying puts. Meanwhile, grab a beer and a brat and watch the thresholds.

Send questions for next week to askkase@kaseco.com, and for energy hedging visit the Kase Energy Hedging Services page.

Charts created using TradeStation. ©TradeStation Technologies, Inc. 2001-2015. All rights reserved. No investment or trading advice, recommendation or opinions are being given or intended.

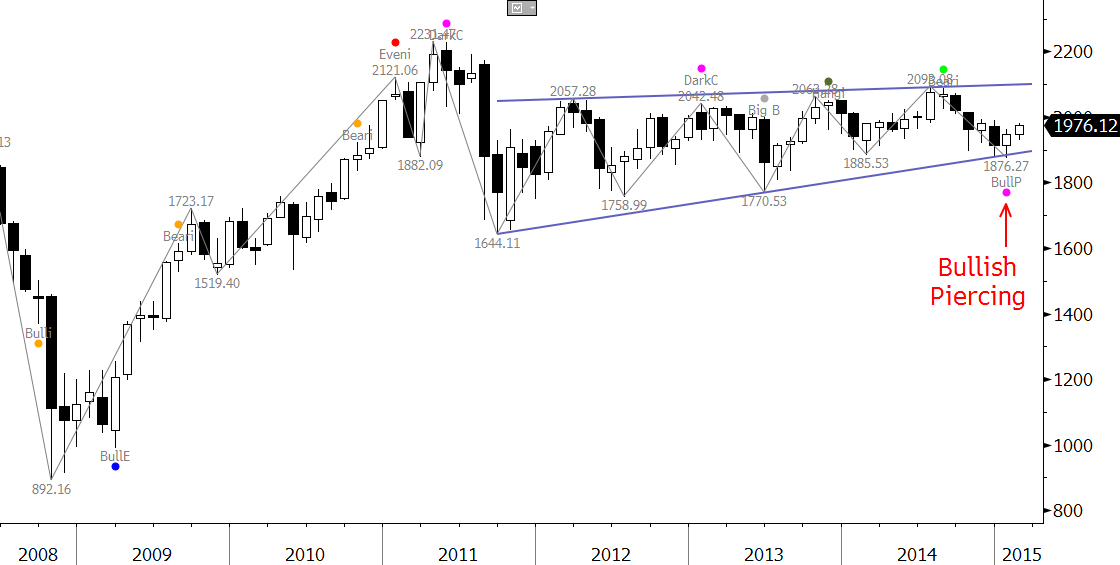
Since late 2011 the Korean Stock Exchange (KOSPI) has oscillated in a narrowing range, now nearing its apex, which means a breakout is expected within the next quarter or two, perhaps sooner.

The pattern began after 2011’s decline to 1644.11. The entire pattern could be the middle “B” wave of a downward ABC correction, or, alternatively the first wave of a renewed push higher. This will remain an open question until there’s a break out, but recent technicals call for a test the formation’s upper trend line. So odds may indeed favor a break higher.

KOSPI Monthly
KOSPI Forecast Monthly

The first positive factor is a bullish piercing pattern that formed after a test of the pennant’s lower trend line, when January opened below December’s close and closed above December’s midpoint. If February, now trading slightly over December’s 1971.95 open, closes above that point, the bullish tone will be confirmed.

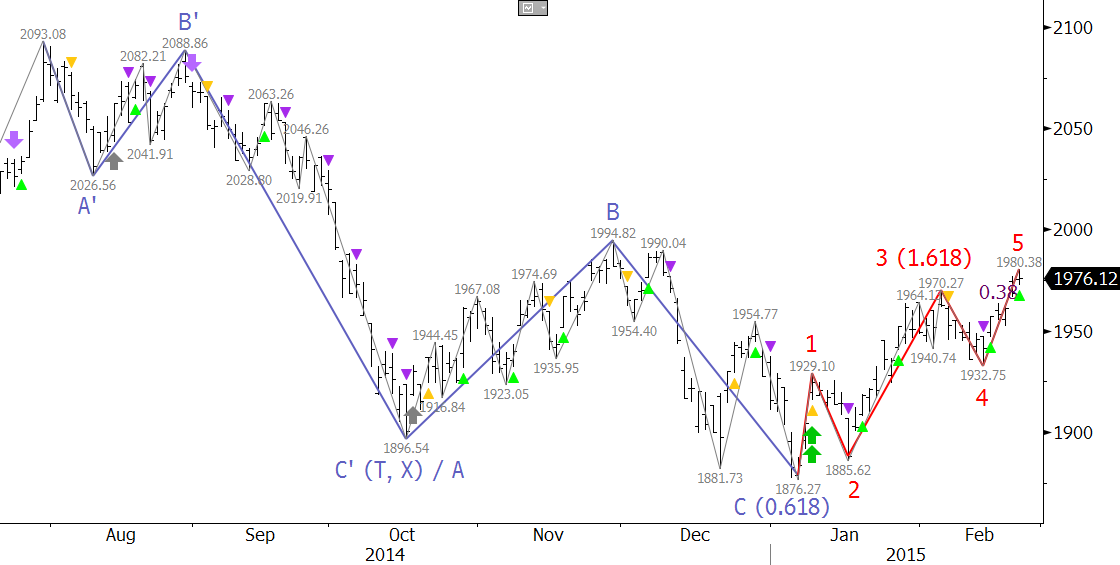
The next bullish factor for this KOSPI forecast can be seen on the daily chart, in red. This is a five-wave trending pattern that met a major target at 1970.27 (the top of Wave 3), and is now poised to extend to key endpoint targets for Wave 5, at 2039.6. Early in the move up a strong buy signal called a pierced dart (two green up arrows and yellow triangle) triggered on the KaseX trading study.

KOSPI Daily
KOSPI Forecast Daily

Hitting 2039.6 would be extremely important because the KOSPI Index would have overcome the top of Wave B, marked in blue. To be considered complete, waves must extend to at least their 0.618, or smaller than, projection. This value was met at 1876.27. Kase’s studies show that just 13 percent of waves stall at this level, the remainder go on to meet their equal to, or 1.0 projection. Overcoming 1994.82 would wipe out Wave C. At that point, the entire wave down from 2093.08 would have to extend down as a whole. Alternatively the wave would be considered complete at the minimum extension, potentially a bearish technical failure.

A bearish failure often results in a sharp rise. Therefore, overcoming 1994.82 could be the catalyst that the KOSPI Index needs to make a decisive upward move.

2039.6 has about 2/3rds odds to be met, and would likely trigger connections to 2158.2 from the waves up from 1644.11. At that point, the resistance line will have been broken. Waves up from 892.16, which also point to 2158.2, might then extend to higher targets at 2336.2 and 2484.3.

In summary, while KOSPI has been oscillating in a neutral range, 2039.6 is the key for an upside test. There could be a pullback at 2039.6, but a sustained close over this, calls for 2158.2, above the upper trend line. A sustained close over this would confirm a valid break higher and open the way for the 2336.2 and 2484.3 targets.

Learn more about Kase’s trading indicators KaseX and Kase StatWare that were used for this KOSPI forecast.

Take a trial of Kase’s weekly energy forecasts that use the same techniques as this KOSPI forecast.

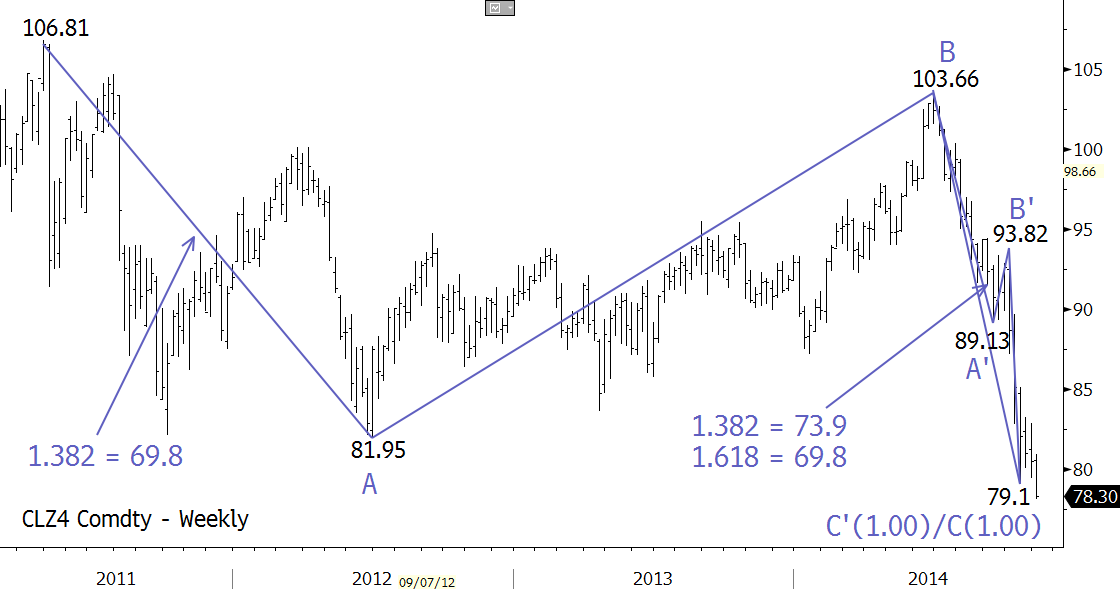
December WTI broke the recent and crucial $79.1 swing low when prices fell to a $78.14 intraday low on Monday. This was the 1.00 projection for the two largest waves down from $106.81 (Wave A) and $103.66 (Wave A’/C). WTI is now poised for at least $73.9 and possibly $69.8, which are the next targets for these waves. Look for near-term resistance at $79.8, $83.0, and $84.8.

For more information about this call, the importance of these targets (and others), and the technical factors driving prices lower, take a trial of Kase’s weekly energy forecasts.

December WTI