Crude Oil Forecast: Brent Oscillating in Bullish Rectangle

By Dean Rogers

For the past few weeks each bit of positive crude oil news or fundamental data has seemingly been offset by something negative. As a result, November Brent has settled into a rectangle formation with boundaries between $47.0 and $50.3.

The upper boundary of the rectangle is poised to be challenged after Monday’s move up to $49.87. The pullback at the end of the day indicates another oscillation lower might take place first, but for now, odds still favor a break higher. A close over $50.3 would call for at least $51.7.

Main20151005152653

Conversely, Brent’s move up has already failed once after breaking higher out of a bullish pennant on September 15. Since then the rectangle has formed. Should the rectangle fail, and prices close below $47.0, look for at least $45.3.

This is a brief analysis and outlook for the next day or so. Our weekly Crude Oil Commentary is a much more detailed and thorough energy price forecast. If you are interested, please sign up for a complimentary four week trial.

By Dean Rogers

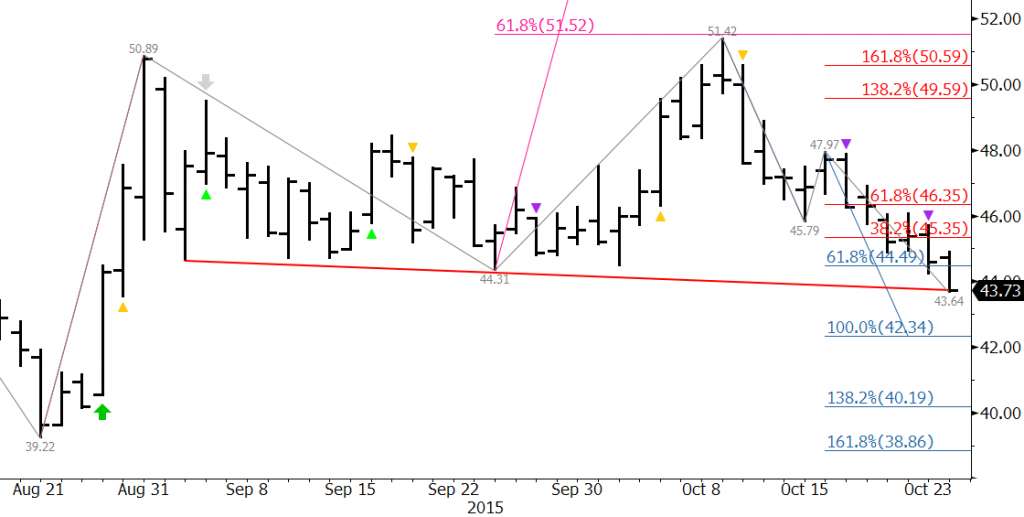
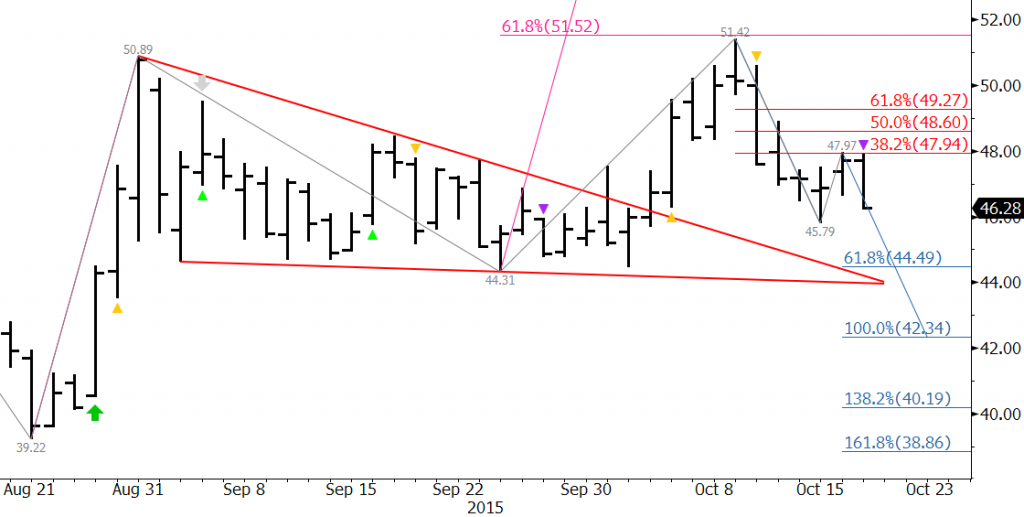
After the late August rally WTI settled into a narrowing range that forms a pennant. This is a continuation pattern that indicates odds favor a break higher. However, these odds are somewhat dampened due to the price rise that took place before their formation was small in comparison to the size of the formation. In addition, more than half of the price rise has already been eroded.

wti crude oil

The small wave up from $43.71 indicates that a close over $46.0 would call for $47.0, which is in line with the top of the pennant.

We like support at $44.1 to hold, but $43.0, near the 62 percent retracement of the move up, is the key for a negative outlook.

On balance, even if prices break higher or lower out of the pennant, we could see crude oil continue to oscillate in a wider range for another few weeks while the market sorts out fundamental and geopolitical factors.

This is a brief analysis and outlook for the next day or so. Our weekly Crude Oil Commentary is a much more detailed and thorough energy price forecast. If you are interested, please sign up for a complimentary four week trial.

By Dean Rogers

Last week we stated WTI and Brent would likely settled into trading ranges while sorting out longer-term fundamental factors and the late August price surge. That has been the case, and so far the oscillations have formed a flat descending triangle for WTI and a pennant for Brent.

WTI and Brent patterns

Both patterns are bullish, but have a higher than normal probability to fail in our opinion. Even upon a break higher we do not expect a bullish rally to ensue, but rather a test of the recent swing highs.

Should the patterns fail look for major support at $42.6 for WTI and $46.7 for Brent. In other words, we think the trading range will continue to form between approximately $42.6 and $49.0 for WTI and $46.7 and $52.0 for Brent.

This is a brief analysis and outlook for the next day or so. Our weekly Crude Oil Commentary is a much more detailed and thorough energy price forecast. If you are interested, please sign up for a complimentary four week trial.

By Dean Rogers

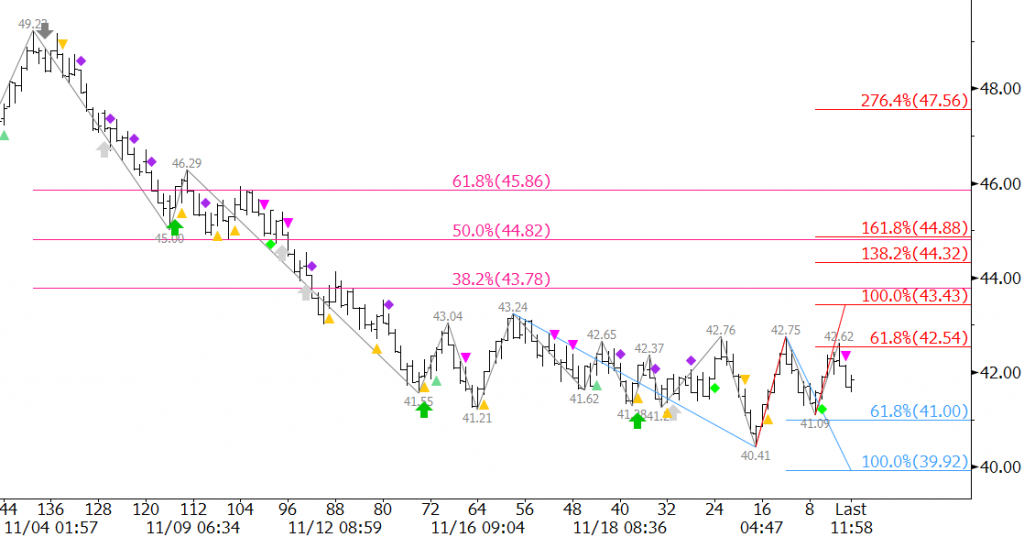
WTI crude oil is settling into a trading, the boundaries of which will be determined over the next week or so. It is still too early to state the exact boundaries. Technical factors tell us the range will likely be set between resistance at $50.5 and support at $42.5. This is a wide, but typical, range for crude oil.

For the next day or so look for prices to rise to at least $46.4 and possibly $47.2. Both are confluent wave projections and retracements. $46.4 is also in line with Monday’s $46.41 swing high.

KaseX confirms Tuesday’s move up with a filtered long signal (green diamond) on the $0.50 Kase Bar chart shown below.

wti crude oil

First support is $44.9 then $44.5 and $43.6. A close below $44.5 would shift odds in favor of at least $43.6 and very likely $42.5.

This is a brief analysis and outlook for the next day or so. Our weekly Crude Oil Commentary is a much more detailed and thorough energy price forecast. If you are interested, please sign up for a complimentary four week trial.

By Dean Rogers

Many market participants are skeptical of Brent’s meteoric rise over the past three days. However, there is no denying the positive technical factors that indicate a bottom has likely been made. The monthly morning star setup and hammer, weekly bullish engulfing line, and daily three white soldiers candlestick patterns are reliable reversal patterns. KaseX also triggered reversal signals (gray arrows) early last week.

Brent Oil

Brent is on the teetering edge of confirming a sustained bullish outlook and has risen to the 50-day moving average at $54.47, the 38 percent retracement from $71.68, and the upper standard deviation band. A close over $54.5 will confirm a positive outlook and call for $55.4 and higher.

That said, because of the confluence of technical resistance at $54.5 this is a very likely stalling point. We expect a test of support at $51.9 within the next few days and likely before Brent closes over $54.5. A close below $51.9 would call for $50.6 and $49.7. The latter must hold for the near-term outlook to remain positive.

This is a brief Brent oil forecast and outlook for the near-term. Our weekly Crude Oil Commentary is a much more detailed and thorough energy price forecast. If you are interested, please sign up for a complimentary four week trial.

By Dean Rogers

On Friday evening I sat down to write Kase’s detailed weekly forecasts on WTI crude oil and Brent with an image of Chicken Little running around warning all of his pals that the sky is falling. This is a feeling that resonated with many market participants around the world as stock indices and commodities have plunged lower.

The reality is WTI and Brent will find a bottom soon, and there are logical/technical points at which these bottoms could form. From a technical standpoint, WTI crude oil is already well oversold and due for a correction. There are daily and weekly divergence setups on many momentum indicators, including our own KaseCD and KasePO, but this has been the case for weeks. Therefore, until a significant retracement takes place, reversal patterns form, and the daily and weekly momentum divergences are confirmed, the outlook will remain negative.

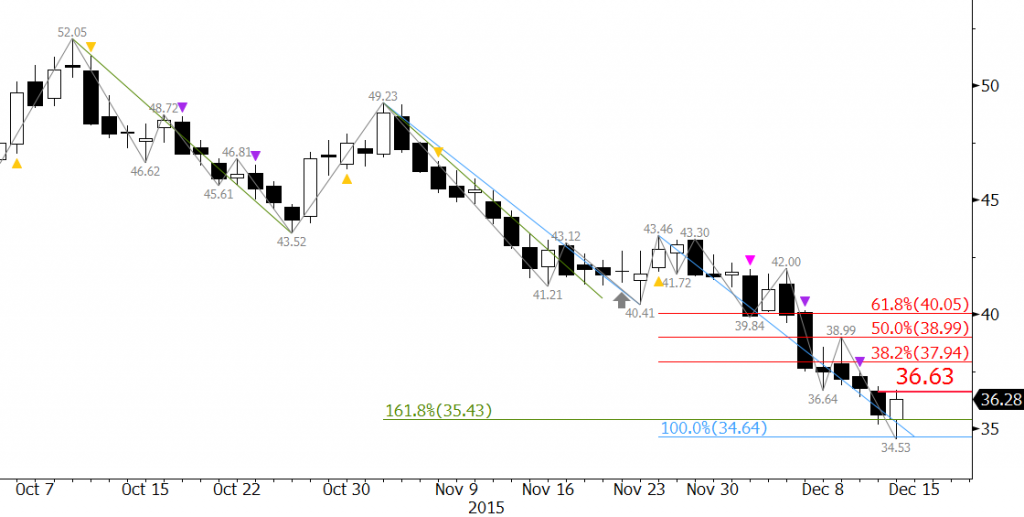
WTI met major support at $37.9 when it fell to $37.75 early Monday and settled at $38.24. Given today’s price action though, it looks as though the decline is going to continue to extend. WTI pulled back to $39.5 where an intraday double top formed, and the pattern was confirmed when prices fell below $38.3. The projection for the double top is $37.1. Look for at least $37.52, the 1.618 projection of the wave down from $39.5, and then $37.1 tomorrow.

crude oil

The small pullback from $37.83 may extend to $38.45 and even $38.88 first. The 38 percent retracement of the decline from $39.46 to $37.83 is $38.45 and the 62 percent retracement is $38.88. The latter is also the 0.618 projection of the wave up from $37.75 and is expected to hold. A close over this would call for an extended upward correction.

This is a brief analysis and outlook for the near-term. Our weekly Crude Oil Commentary is a much more detailed and thorough energy price forecast. If you are interested, please sign up for a complimentary four week trial.

By Dean Rogers

The world’s supply of crude oil continues to outpace demand, and consequently the global supply glut is being forecast through 2016. WTI fell to its lowest level in over six years last week and Brent is inching its way closer to testing the $45.19 low made on January 13, 2015. A move below this would be the lowest price at which Brent has traded at in over six years.

Structurally, the market is overdue for a correction and Brent’s daily morning star setup, a bullish candlestick pattern, warns that such a correction might take place soon. The decline’s momentum is also weakening, and there are daily and weekly divergence setups for Brent.

Brent and products attempted to stabilize and even rise in a corrective manner last week, but the move stalled. On Friday Brent crude broke lower out of the intraday coil shown below on the $0.50 Kase Bar chart.

brent crude

The break lower out of the coil indicates the decline should continue. The waves projections down from $55.0 (green), $51.69 (light blue), and $50.83 (blue) call for at least $47.9. This is a confluent wave projection that connects to $46.9 and finally $45.5.

The move down is becoming a grind, but until Brent crude can close over at least $49.9, look for the move down to extend. A close over $49.9 would at least create the potential for an extended upward correction.

This is a brief analysis and outlook for the near-term. Our weekly Crude Oil Commentary is a much more detailed and thorough energy price forecast. If you are interested, please sign up for a complimentary four week trial.

By Dean Rogers

For the past eight weeks September WTI crude oil futures have closed lower, and the decline is quickly approaching major support at $42.5. Many pundits claim the sky is falling, but it is usually at times like this that the market will finally find support and at least attempt to make a bottom.

We have discussed $42.5 as major target and potential bottom in our weekly blog update and in our detailed crude oil forecast for several weeks. There is no definitive evidence that the move down is going to end, but on Monday a few positive signs formed that indicate an extended upward correction may take place.

Monday’s bullish engulfing line, exhausted daily KasePO and KaseCD momentum, weekly divergence setups, and the intraday wave up from $43.35 all show that the upward correction may test $45.9 and possibly $47.5 before the decline continues.

wti crude oil

For now, there is no evidence that this will be a major correction, not yet at least, but the fact that the market is starting to show some positive signs of life could mean the move down will end soon.

That said, important resistance was met at $45.01, so we expect to see a pullback to $44.3, Monday’s midpoint, in early trading Tuesday. A close below $44.3 would negate many of the aforementioned positive factors and open the way for $42.5 to finally be met.

This is a brief analysis and outlook for the near-term. Our weekly Crude Oil Commentary is a much more detailed and thorough energy price forecast. If you are interested, please sign up for a complimentary four week trial.

By Dean Rogers

Crude oil has taken on a strong bearish tone. There is very little technical evidence, and even less fundamental evidence, that the decline is going to end. However, it is almost always darkest before dawn and there are a few factors that show a correction should take place soon.

Last week’s update discussed major support at $47.0 for WTI and September Brent crude oil is quickly approaching major technical support at $52.8. This is the 1.618 projection for $71.37 – 62.3 – 62.49, the 0.618 projection for $67.49 – 55.6 – 59.9, and the lower Bollinger Band. The KasePO, shown in the middle panel of the chart above, and KaseCD, in the bottom panel, are setup for divergence and nearly in oversold territory. These factors indicate $52.8 is a potential stalling point and that a correction might take place before the decline continues to the next targets.

Brent

A normal correction will hold $55.6, the 38 percent retracement from $59.9. Key resistance is $57.2, the 62 percent retracement. We expect $55.6 to hold before the next leg lower takes place.

This is a brief analysis and outlook for the near-term. Our weekly Crude Oil Commentary is a much more detailed and thorough energy price forecast. If you are interested, please sign up for a complimentary four week trial.

Prompt month WTI crude oil futures briefly fell below $50.0 on Monday and settled at the lowest level since April 2. The deal with Iran has led to fresh concerns about the global supply glut and most technical factors are negative. RBOB gasoline is lending some support, but on balance, the decline is poised to extend into the mid- and possibly low-$40s where the March 18th low of $42.03 would be challenged.

Prices broke lower out of the near perfect intraday bearish flag discussed last week. September WTI futures, which will become the prompt month on Wednesday, also settled below key support at $50.6 on Monday. This was the 1.618 projection of the wave $64.45 – 57.09 – 62.51. This is likely Wave I of a five wave trending pattern that should unfold to at least $47.0 and possibly $42.5. The five-wave pattern is not perfect, but the close below $50.6 and the bottom of Wave III leaves little room for any other interpretation.

WTI Crude Oil

When a five-wave pattern forms at least two of the three impulse waves (I, III, or V) should be equal. At $47.0 Waves I and V will be equal and at $42.5 Waves III and V will be equal. Structurally, both $47.0 and $42.5 fit the structure of the five-wave pattern because $47.0 is the 0.618 projection of Wave III, $62.51 – 50.95 – 54.35 and $42.5 is the 2.764 projection for Wave I.

It is important to note that $42.5 is the lowest that the five-wave pattern projects. Therefore, unless the structure of the wave formation drastically changes, it is not likely that prices will fall below $42.5 in coming weeks.

Odds favor the decline, but the market still seems a bit unsure of itself. As stated, there is some support being wrought by RBOB gasoline, but it ended Monday on a negative note by forming an evening star setup. The move down will likely be a grind and small tests of resistance will be commonplace. First resistance is $51.8 followed by $52.8, which is expected to hold. Key resistance is the $54.35 swing high. A close above this would negative the five-wave pattern and open the way for an extended correction and potential recovery to $59.3 and higher.

Our weekly Crude Oil Commentary is a much more detailed and thorough energy price forecast. If you are interested, please sign up for a complimentary four week trial.