Crude Oil Short-Term Forecast – February 13, 2018

Outlook for WTI

March WTI crude oil’s formation of a second daily star (in this case a hammer), confirmed daily KCDpeak, oversold Stochastic, and failure to break the $58.07 swing low are all factors that indicate the upward correction from $58.07 still has a reasonable chance of extending before the decline continues. However, unless WTI settles above at least $59.8 and more likely $60.4 to confirm the morning star setup (made up of the aforementioned stars) odds will continue to favor a decline.
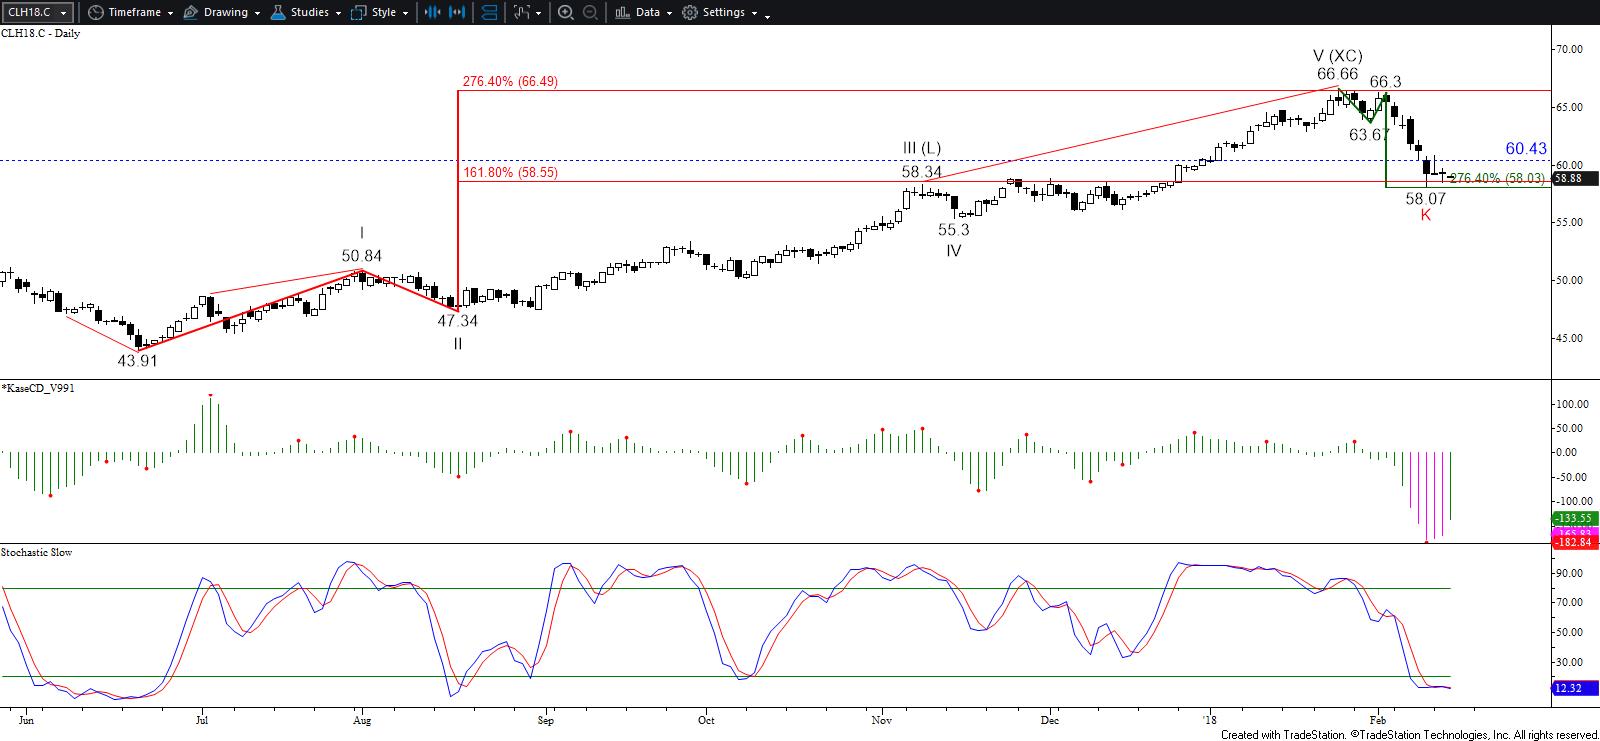
March WTI Crude Oil
March WTI Crude Oil

Initial support is the $58.39 swing low, and an early move below this tomorrow will call for $58.0, the smaller than (0.618) target of the wave $60.83 – 58.39 – 59.49. This is a key objective because it is the lowest that the initial wave down from $66.66 projection and is the 38 percent retracement of the move up from this past summer’s $43.91 swing low. Settling below $58.0 will open the way for $57.6 and very likely $57.1, the equal to (1.00) target of the wave down from $60.83.

Should the upward correction attempt to extend again tomorrow, look for initial resistance at last Friday’s $59.8 midpoint. This is the completion point of the morning star setup, a close above which would call for the $60.4 confirmation point. The $60.4 level is key for the near-term because it is also sitting just above the smaller than target of the wave up from $58.07. Settling above $60.4 would call for a likely move above the $60.83 swing high to $61.4, which is in-line with the equal to target of the wave up from $58.07 and the 38 percent retracement of the decline from $66.66.

This is a brief analysis for the next day or so. Our weekly Crude Oil Commentary and daily updates are much more detailed and thorough energy price forecasts that cover WTI, Brent, RBOB Gasoline, Diesel, and spreads. If you are interested in learning more, please sign up for a complimentary four-week trial.


After a good up month in April for the British Pound, some pundits are calling for weakness, and attributing this to the probability that post the UK’s May 7 election, formation of a coalition government is likely.

This virtual eventuality has been in the news for at least a couple of months. If it were so bearish, one would think it would have become a factor much sooner than six days before the election.

Despite the prospect of a coalition government, a coalition led by Cameron versus Miliband is not the same thing. The Economist endorsed Cameron notwithstanding some drawbacks, such as a possible alliance with anti-EU UKIP. It looks like his leadership, even so, would be better for the UK economically than one led by Miliband, whose cumulative redistributionist ideas could scare away high earners and entrepreneurs.

It’s been said that explanations are always after the fact. Let’s see what the British Pound/US Dollar is saying for itself.

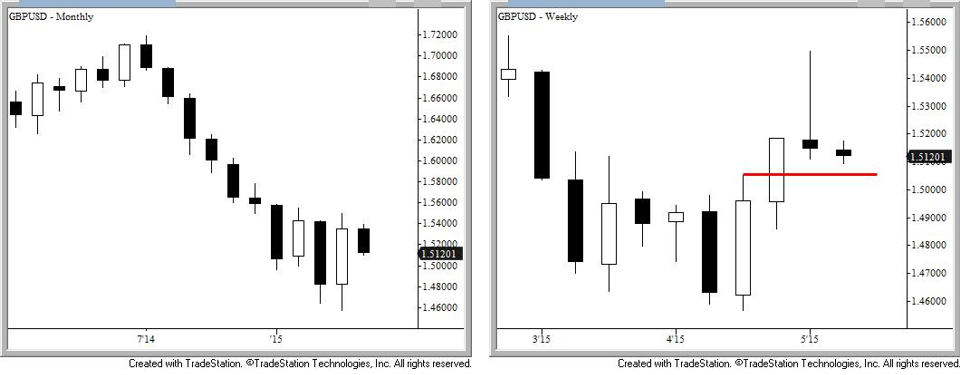
The rise in value of the pound from April 13 to 29 has the characteristic of being driven by over exuberance. There are many opens that jumped higher than the previous day’s close, or if not, opened only a hair below. This looks like typical short-term emotionality.

The high of this move, 1.54969 failed to overcome that of more than two months earlier, 1.5512, so it’s not as if we’re talking about a major bull market here. Indeed all the bullish excitement has been about one up month, April. This overhyped month, though it had a reasonably large open-close range, failed to close over March’s open.

Technically charts show what’s called a piercing pattern, versus, an engulfing line. So though April “pierced” March’s armor, March was not engulfed. Clearly then this dampens April’s importance.

April was number 10 in a 10 month decline, and only the second to be an up month (the other was February). April made lows not seen since July 2010. The price low triggered a very mild oversold signal, but it’s not unusual for this to happen and be followed by a bit of a bounce.

Negating the importance of this is that overbought April, at least so far, has not been confirmed by and up closing May (again so far). The fact that May’s been down decreases the significance of the oversold signal, and even more so emphasizes a lack of disparity between negative momentum and negative trend.

The weekly is setting up a bearish pattern called a Harami star. A close below about 1.50, which is last week’s open-close midpoint, and the high for the week prior, would call for expectations to clearly look lower.

Indeed last week’s high was well above both its open and close. This means that prices tried very hard to climb up, fell right back down, in this case, to just below the where prices started the week.

Monthly and Weekly Candlesticks

GBPUSD

All markets have corrections, and often it’s expected that these will be of particular magnitudes. Here, another bearish factor is that the price decline smashed through the 38 percent retracement, and would now be expected to decline at least to about 1.503ish to meet next major retracement of 50 percent.

Bottom line is that the British Pound can’t tell us who will be the next Prime Minister, or whether a coalition must be formed, but it is telling us that it’s not feeling very well right now.

There have only been a few down days so far this month, and the down move may prove only corrective, but if we see a close below $1.50ish, then a retest of April’s low might become increasingly likely.

Charts created using TradeStation. ©TradeStation Technologies, Inc. 2001-2014. All rights reserved. No investment or trading advice, recommendation or opinions are being given or intended.

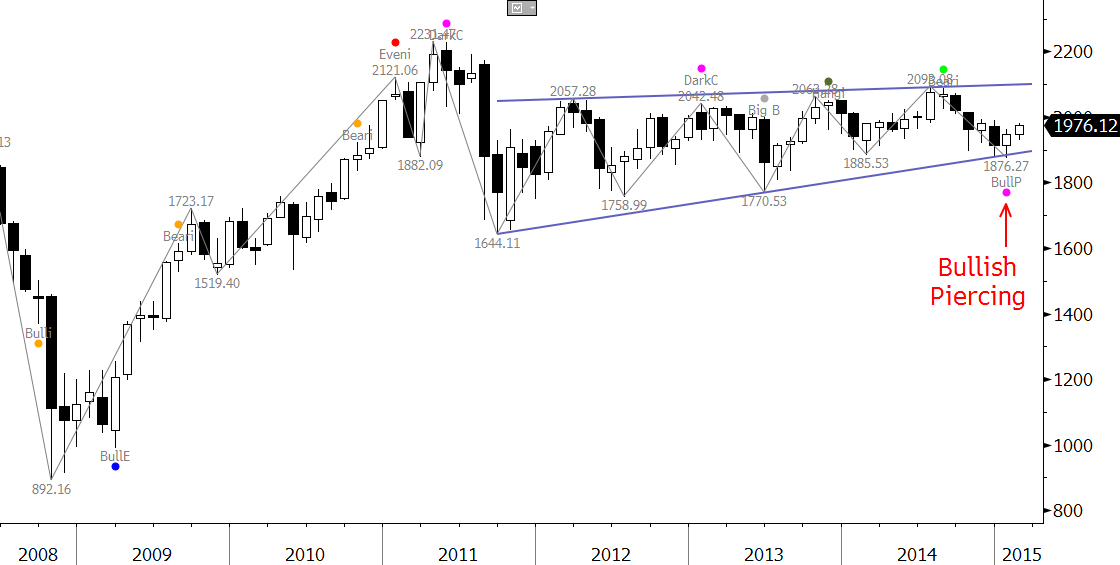
Since late 2011 the Korean Stock Exchange (KOSPI) has oscillated in a narrowing range, now nearing its apex, which means a breakout is expected within the next quarter or two, perhaps sooner.

The pattern began after 2011’s decline to 1644.11. The entire pattern could be the middle “B” wave of a downward ABC correction, or, alternatively the first wave of a renewed push higher. This will remain an open question until there’s a break out, but recent technicals call for a test the formation’s upper trend line. So odds may indeed favor a break higher.

KOSPI Monthly
KOSPI Forecast Monthly

The first positive factor is a bullish piercing pattern that formed after a test of the pennant’s lower trend line, when January opened below December’s close and closed above December’s midpoint. If February, now trading slightly over December’s 1971.95 open, closes above that point, the bullish tone will be confirmed.

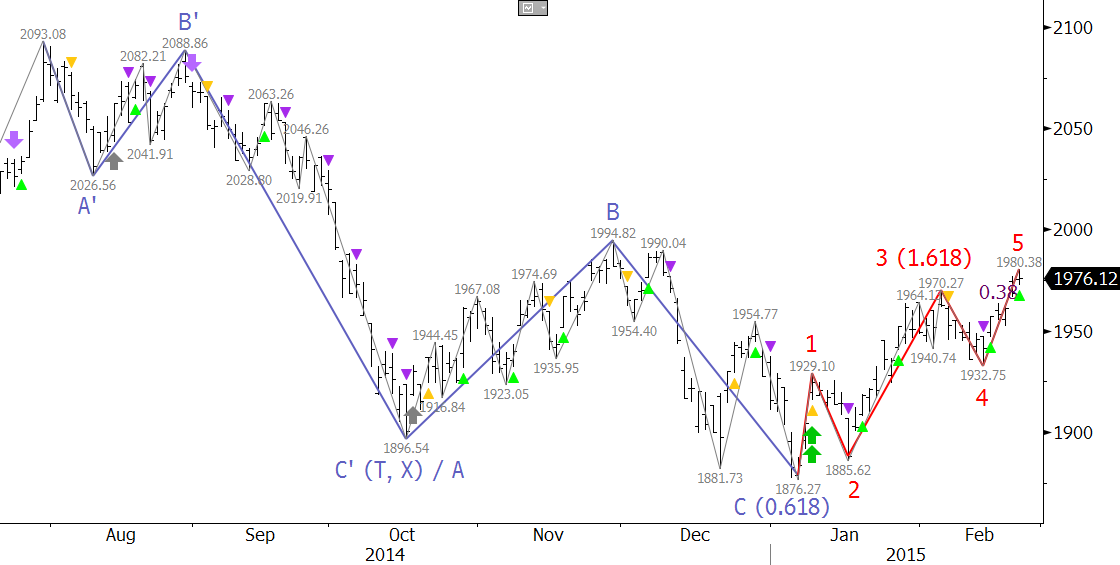
The next bullish factor for this KOSPI forecast can be seen on the daily chart, in red. This is a five-wave trending pattern that met a major target at 1970.27 (the top of Wave 3), and is now poised to extend to key endpoint targets for Wave 5, at 2039.6. Early in the move up a strong buy signal called a pierced dart (two green up arrows and yellow triangle) triggered on the KaseX trading study.

KOSPI Daily
KOSPI Forecast Daily

Hitting 2039.6 would be extremely important because the KOSPI Index would have overcome the top of Wave B, marked in blue. To be considered complete, waves must extend to at least their 0.618, or smaller than, projection. This value was met at 1876.27. Kase’s studies show that just 13 percent of waves stall at this level, the remainder go on to meet their equal to, or 1.0 projection. Overcoming 1994.82 would wipe out Wave C. At that point, the entire wave down from 2093.08 would have to extend down as a whole. Alternatively the wave would be considered complete at the minimum extension, potentially a bearish technical failure.

A bearish failure often results in a sharp rise. Therefore, overcoming 1994.82 could be the catalyst that the KOSPI Index needs to make a decisive upward move.

2039.6 has about 2/3rds odds to be met, and would likely trigger connections to 2158.2 from the waves up from 1644.11. At that point, the resistance line will have been broken. Waves up from 892.16, which also point to 2158.2, might then extend to higher targets at 2336.2 and 2484.3.

In summary, while KOSPI has been oscillating in a neutral range, 2039.6 is the key for an upside test. There could be a pullback at 2039.6, but a sustained close over this, calls for 2158.2, above the upper trend line. A sustained close over this would confirm a valid break higher and open the way for the 2336.2 and 2484.3 targets.

Learn more about Kase’s trading indicators KaseX and Kase StatWare that were used for this KOSPI forecast.

Take a trial of Kase’s weekly energy forecasts that use the same techniques as this KOSPI forecast.

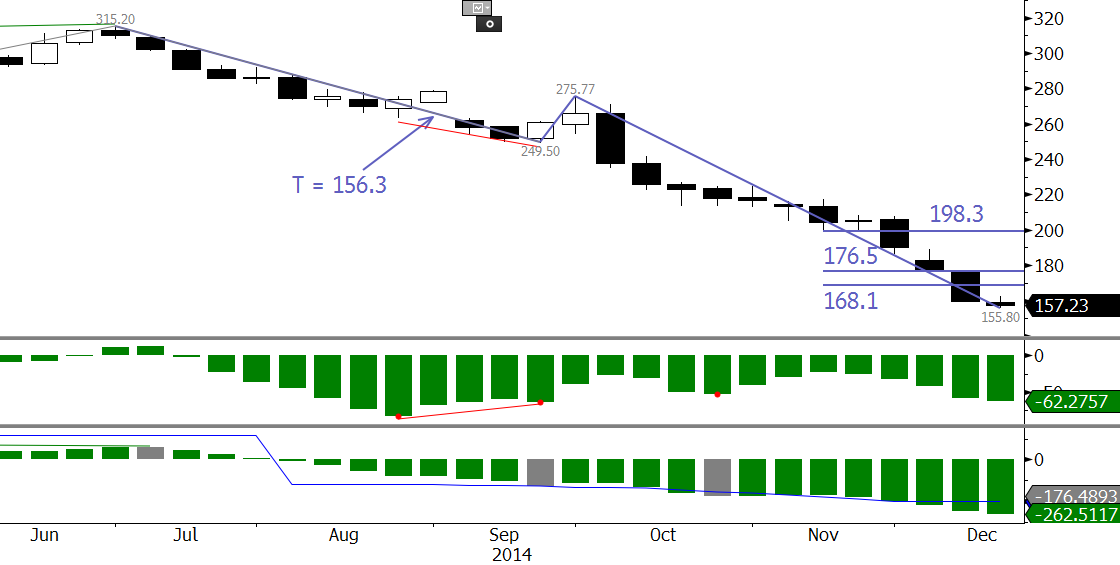
RBOB Gasoline continued its decline and met a crucial target at 155.8 for the primary wave down from 315.2. The trend terminus (T = 156.3), is the lowest that most trends extend. However, there is no evidence that the decline is going to end. The next targets are 147.3 and 139.2. The KaseCD is setup for divergence and the KasePO is oversold, so a correction may take place soon. Last week’s midpoint and open are initial resistance at 168.1 and 176.5. A close over 176.5 would call for $198.3.

rbob