S&P 500 Will Break Out Of Pennant, But Which Direction?

SPXby Dean Rogers

Read on TraderPlanet.com

You can feel it in the air, the mounting anticipation of an interest rate hike is coming to a head as investors, traders, and even my own feisty grandmother are jockeying for position ahead of this week’s Fed meeting.

Some pundits believe a rate hike at this time would be disastrous and that Tuesday’s S&P 500 gain of 1.3 percent was a sign the markets are telling the Fed to wait. Others believe the rate hike is long overdue and that the sooner the Fed raises rates the better.

There is a lot of indecision about what the Fed will do this week. However, one thing is for certain, whether Feds hike rates or not, the market’s direction for at least the next few weeks, and possibly months, will be determined within the next 48 hours.

What Do The Technical Factors Say?

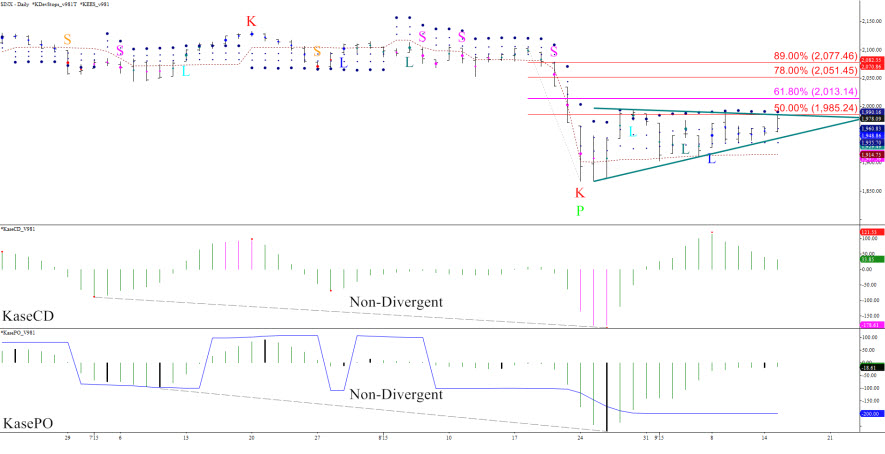
The formation of a pennant reflects the market’s indecision. The pattern is bearish because it formed after the decline to 1867.01 on August 24. That said, there are enough bullish factors to indicate this formation has a higher than normal probability to fail.
SPX-Fig1Charts created using TradeStation. ©TradeStation Technologies, Inc. 2001-2015. All rights reserved. No investment or trading advice, recommendation or opinions are being given or intended.

Bearish Technical Factors

  • Pennant
  • Move up from 1867.01 stalled near the 50 percent retracement of the decline from 2103.47
  • Held Kase’s daily DevStop3 (large blue dot)
  • Decline to 1867.01 was non-divergent

The bottom of the pennant is near 1950 and a close below this would open the way for 1903. This then connects to confluent wave projections at 1838, 1732, 1665, and 1567. Upon a break lower out of the pennant we expect to see at least 1838 and very possibly 1732.

The lowest target at 1567 is interesting because it is near the 38 percent retracement from the March 2009 swing low of 666.79 to the recent 2134.72 swing high. In addition, 1567 is near the October 2007 high of 1576.09, just before the financial crisis, and the March 2000 high of 1552.87, just before the dotcom crash.

I am not calling for 1567 yet, but from a longer-term perspective, a decline to 1567 would be a normal technical correction (38 percent), and a 25 percent correction from high to low (less than half of the financial crisis’s decline).

Bullish Technical Factors

  • KCDpeak and PeakOut (oversold signals)
  • KEES buy signals (blue L’s) and long permissions (blue dots)

A close over 1985 would confirm the bearish pennant has failed and open the way for at least 2022, the 1.00 projection for the wave 1867.01 – 1993.48 – 1903.07. Then connects to confluent projections at 2070 and 2109 as the 1.382 and 1.618 projections, respectively. The latter is the last level protecting the 2134.72 high.

Conclusions

It is a very tough call and the market could break either way. On balance though, I see enough bearish evidence to state that I think the Fed will hike rates and the markets will break lower.

Now if you’ll excuse me, I need to call to my grandmother and tell her not to bet the farm on the downside. Maybe some puts are in order.

“Ask Kase” and your question may be chosen as the subject of a future column (askkase@kaseco.com).

Send questions for next week to askkase@kaseco.com, and click the link learn more about the KasePO, KaseCD, KEES, and the Kase DevStops.

Mon1By Cynthia A. Kase

Read on TraderPlanet.com

Six big firms dominate the agricultural supply business today, having bought up over 200 smaller companies and their intellectual property over the past 25 years or so. Monsanto, the world’s largest seed supplier, and BASF both reportedly tried to buy rival Syngenta. Though no deals went through, it looks like the industry is in for another round of consolidation. One of Monsanto’s problems is that weeds are becoming resistant to its star product, Roundup, and commodity prices are down, reducing farmers’ ability to pay for its goods. A merger would help by giving it economies of scale which could improve its both prices and its pace of innovation.

The Monsanto stock price itself is now about 30 percent off its post-recession $128.79 high. Is Monsanto stock in the weeds or will it round UP?

Analysis

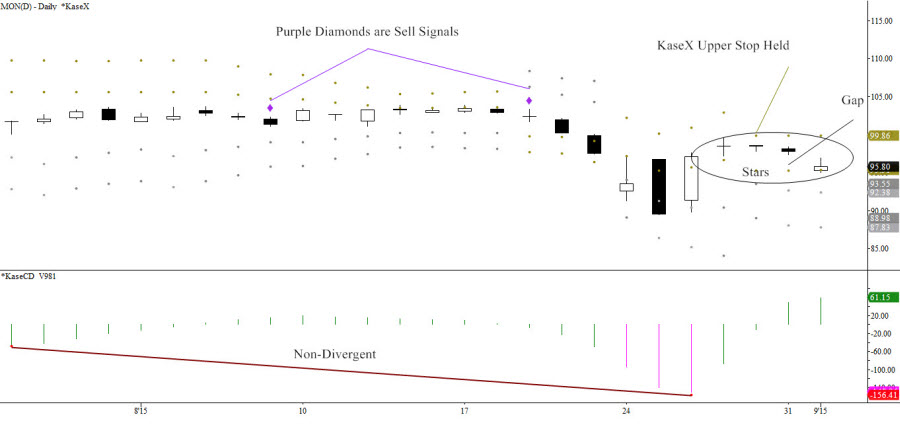
I’m biased to the downside primarily for these bearish reasons. The last four days, following last Wednesday’s big up day, have been stars, or small open-close range days. There was a possible breakaway gap down this morning. Kase’s daily upper stop has held. Momentum is non-divergent. The two most recent signals on KaseX, purple diamonds, were sell signals. All these are shown in the chart below.

mon2


Charts created using TradeStation. ©TradeStation Technologies, Inc. 2001-2015. All rights reserved. No investment or trading advice, recommendation or opinions are being given or intended.

If the $10 recovery lengthens, it’s no big deal if $98 is tested. The price to watch is $101. There’d have to be a three sigma move of the daily double TrueRange for $101 to be hit. This is also the minimum, 0.62 extension for the bounce from $89.34 to $99.48, and the midpoint of the candlestick for the week ending August 7. Above this, there’s heavy resistance in the $105 to $107 area, but odds then swing in favor of a recovery right back to May’s highs of $123 plus.

The decline to $89.34 was about $0.75 shy of $88.6 support, which must be clearly broken for a continuation lower. $88.6 is the 1.62 extension for the major recent wave is 128.79 – 105.76 – 126.0, and the 1.38 extension for the first wave down from $123.82. The trend terminus for both these waves is $71.25. Importantly, the correction from $89.34 to $99.48 targets $88.6 as the Phi-cubed projection. $88.6 is Kase daily DevStop2 and weekly DevStop1, so it is confluent statistically.

It’s not unusual for trending patterns elongate in such a way as to stretch key targets to more extreme levels. This is what’s happened for Monsanto. After falling from $128.79 to $105.76 in 2014, prices recovered to $126 earlier this year. Waves down from $126 have pushed the major downside target to$86.7. This is the “trend terminus” for the wave from $126.0 to $111.16, and the 1.0 extension from $126.0 to $103.14. Very importantly, $86.7 is the 50 percent retracement of the entire move up from the recession low of $44.61.

Outlook

Structurally, there’s a reasonable chance for $86.7 holding support, otherwise, I’d look for a free fall to $71.25. Below that don’t get lost after landing in the weeds!

Send questions for next week to askkase@kaseco.com, and click the link learn more about KaseX and the Kase DevStops.

Read on TraderPlanet http://www.traderplanet.com/commentaries/view/168639-ask-kase-core-commodity-crb-index-positioned-to-challenge-2015-low/by Dean Rogers

Read on TraderPlanet

The recent Chinese stock market downturn and depressed economic outlook by many economists for the second quarter and through year’s end for China’s economy has commodity prices backpedaling. Many components of the Thomson Reuters Core Commodity CRB Index, and the Index itself, have either fallen to new lows or are poised to test lows that were made earlier this year.

In addition, the nuclear deal with Iran also raises concerns about an increased oil supply glut, and energy is one of the most heavily weighted components in the CRB Index. In fact, on March 18, 2015 the CRB index fell to 206.13. This coincided with WTI Crude Oil’s $42.03 low. Both are on the teetering edge of challenging this year’s lows.

The question is: Will commodity prices and the CRB Index fall to a new low for 2015?

The gap lower from 224.107 on July 6th was the catalyst for the decline to 213.107. The wave 233.531 – 218.917 – 229.328 met its 1.00 projection at 213.107. This was also the 1.618 projection for the wave 229.328 – 221.095 – 227.473, and just below the 62 percent retracement from 206.813 to 233.531. The confluence of wave projections and retracements at 213.107 make it a decision point for a continued decline.

Taking out 213.107 would call for 203.5. The aforementioned waves down from 233.531 and 229.328 project to 203.5 as the 1.618 and 2.764 targets, respectively. This is also the 1.00 projection for the wave 227.473 – 213.107 – 219.898, and most importantly, the 0.618 projection for the large-scale wave 473.91 – 200.16 – 370.72. The importance of 203.5 make it a likely stalling point.

A sustained close below 203.5 would be the result of a deeply negative outlook for the global economy. In this case, the next targets would be 192.0 and 178.6.

CRB_Index.jpg

Charts created using TradeStation. ©TradeStation Technologies, Inc. 2001-2015. All rights reserved. No investment or trading advice, recommendation or opinions are being given or intended.

That said, the move up from 213.107 is testing resistance at 220.9. This is the 38 percent retracement from 233.531, near the bottom of July 6th’s gap, and the midpoint of April’s candlestick. A close over 220.9 will call for 227.5. This is key resistance because 227.5 is in line with the 227.473 swing high, the top of the gap at 224.107, the 62 percent retracement of the decline from 233.531, and the 0.618 projection of the wave 206.813 – 233.531 – 213.107. A close over 227.5 would open the way for 238.1 and 248.1.

The upward correction was preceded by daily bullish divergences on the KaseCD, MACD, and slow stochastic. In addition, a bullish morning star setup and hammer has formed on the weekly chart. These factors indicate the upward correction might extend to fill the gap and test 227.5 before the decline continue. Overall though, with all factors considered, 227.5 is expected to hold and odds favor a decline to 203.5.

Send questions for next week to askkase@kaseco.com, and for our weekly energy forecasts visit www.kaseco.com/services/energy-price-forecasts/.