WTI Crude Oil Technical Analysis and Short-Term Forecast
This is a brief analysis for the next day or so. Our weekly Crude Oil Forecast and daily updates are much more detailed and thorough energy price forecasts that cover WTI, Brent, RBOB Gasoline, Diesel, and spreads. If you are interested in learning more, please sign up for a complimentary four-week trial.
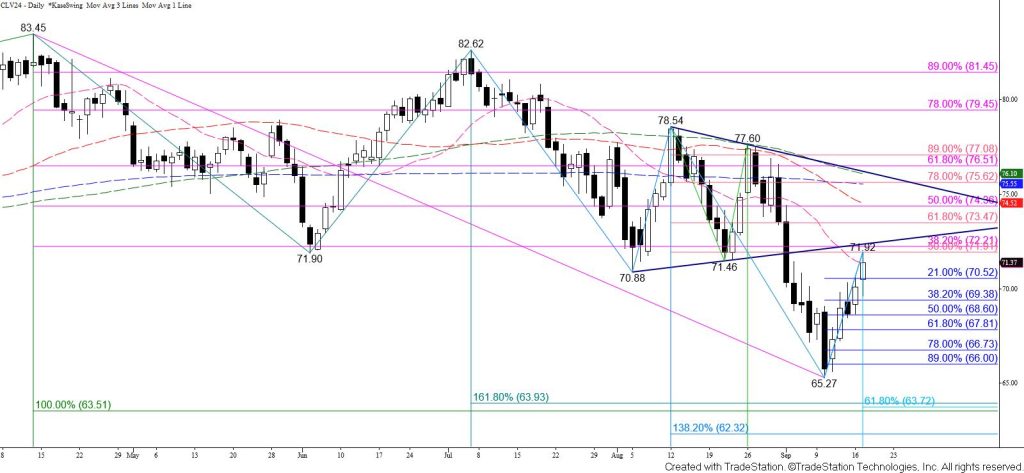
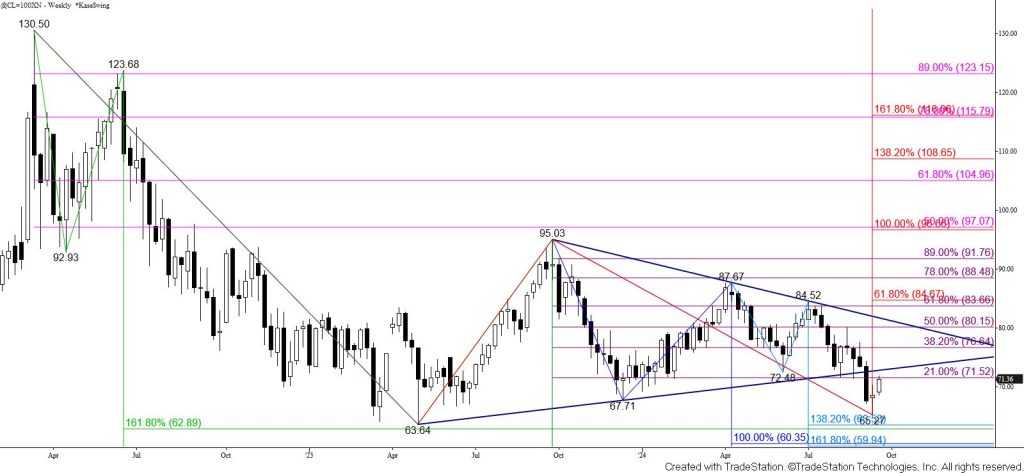
WTI crude oil has recovered after briefly settling below a highly confluent and key wave projection and retracement level at $66.5 on September 10. The close below $66.5 only lasted a day and the subsequent move up from $65.27 has been quite aggressive. A weekly long-legged doji, daily bullish RSI divergence, and daily Stochastic oversold signal suggest a bullish reversal might be underway. However, the challenge is that the move up might be a throwback to test the lower trend line of a coil pattern on the October chart and wedge pattern on the continuation chart, both of which broke lower on September 3.
CLV24 Daily Chart with Coil

For the move down to extend again WTI crude oil must hold the lower trend lines of these patterns, which currently center around $72.5. The $72.5 is also the highest that the first intra-day wave up from $65.27 projects and sits just above the 38 percent retracement of the decline from $83.45. Settling above $72.5 for a few days and extending to close above the 62 percent retracement from $78.54 at $73.5 would imply that the move down is complete.
WTI Crude Oil Weekly Continuation Chart with Wedge

Nevertheless, closing below the 62 percent retracement of the rise from $65.27, which is currently $67.8 (and will be $68.0 should prices rise to and hold $72.5), would suggest that the move up from $65.27 was a throwback and a correction of the downtrend. For the near term, key support is the 38 percent retracement at $69.4. Closing below this tomorrow would put the odds in favor of testing $67.8 in the coming days.


