WTI Crude Oil Short-Term Price Forecast
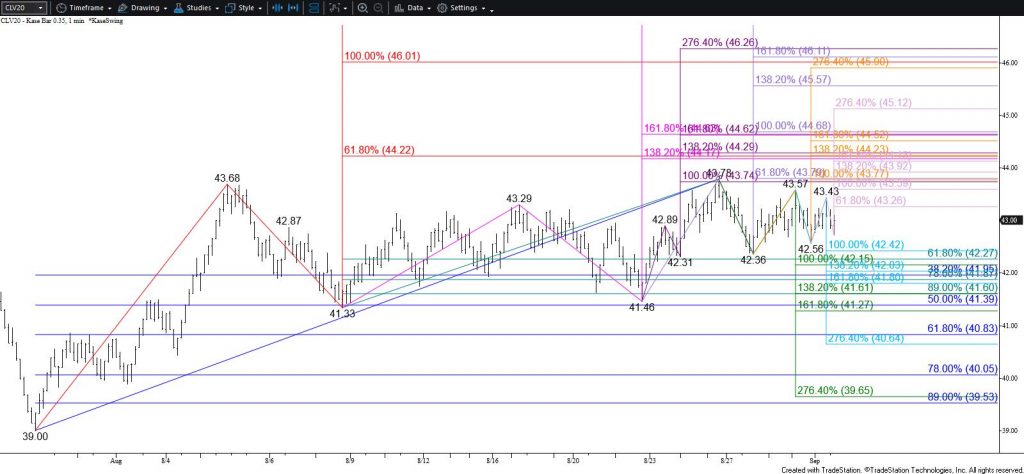
The outlook for WTI crude oil continues to lean negative. WTI settled below the 200-day moving average for the fourth straight day after another early test of resistance. This has formed long upper shadows on the daily candlesticks for the last three days, all of which form shooting star. Granted, shooting stars within a range-bound market are not as reliable as those that form after a long uptrend, but they still reflect near-term weakness.
Nevertheless, WTI settled back above the 20-day moving average today and is still trading in the upper half of the Bollinger Bands, which are squeezing again. There is also a bullish coil that formed on the intra-day charts for the past few days.

The near-term call remains a challenge, but odds still favor an eventual break lower. Closing below $42.3 will clear the way for the key objective at $41.5. This is a highly confluent wave projection and the 50-day moving average. Settling below $41.5 will confirm a break lower out of the Bollinger Bands and clear the way for a much deeper correction before the move up eventually continues.
Conversely, prices have risen a bit after today’s settle, so there is a good chance for a test of $43.3 first. This is the smaller than (0.618) target of the wave up from $42.56 and connects to $43.8. This level is expected to hold. Key resistance and the barrier for a near-term bullish outlook is $44.2. Settling above $44.2 would be a strong indication that a much larger move up is underway.
Brent Crude Oil Short-Term Price Forecast
Brent crude oil settled back above the 20-day moving average today, but the waves down from $46.54 continue to call for a deeper test of support. Falling below $45.0 will open the way for at least $44.2. This is in line with the 50-day moving average and the $44.17 swing low. Settling below $44.2 would strongly indicate that a much larger correction is beginning to unfold.
Trading will likely remain choppy for the near-term though. Resistance at $46.2 is expected to hold and $46.7 is key. Settling above $46.7, which is near the 200-day moving average and the 50 percent retracement of the decline from $66.15, would imply that prices have finally broken higher out of the upward sloping range. This would be quite bullish for the long-term outlook.
This is a brief analysis for the next day or so. Our weekly Crude Oil Forecast and daily updates are much more detailed and thorough energy price forecasts that cover WTI, Brent, RBOB Gasoline, Diesel, and spreads. If you are interested in learning more, please sign up for a complimentary four-week trial.


