WTI Crude Oil Technical Analysis and Short-Term Forecast
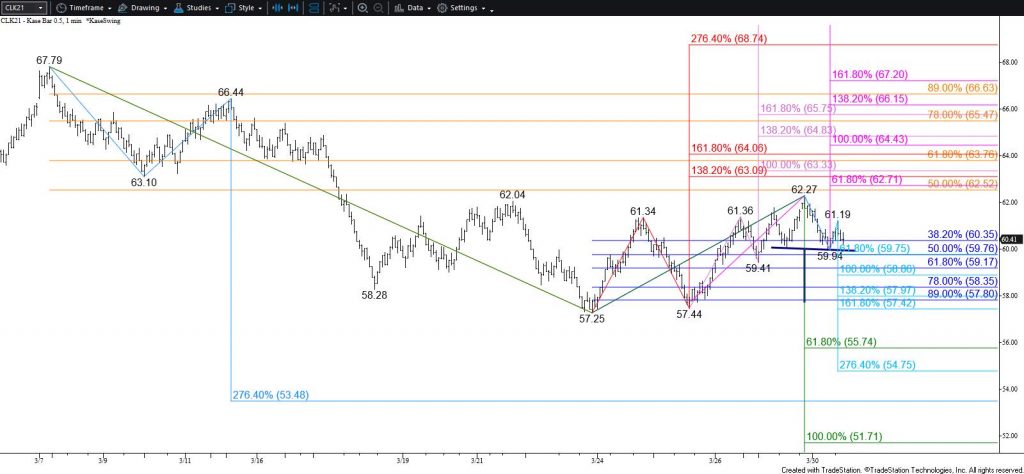
WTI crude oil briefly overcame the $62.04 swing high and invalidated the prior primary wave down from $67.79. However, the move up stalled and a bearish intra-day head and shoulders pattern has formed. The wave down from $62.27 that forms the pattern’s right shoulder is poised to challenge its $59.8 smaller than (0.618) target tomorrow. This is in line with the neckline of the head and shoulders pattern. Closing below $59.8 will call for $59.0 and possibly $57.6, the lower of which is near the target of the head and shoulders. Settling below $57.6 might be a challenge ahead of the OPEC+ meeting later this week but would clear the way for a test of the $55.7 smaller than target of the newly formed primary wave down from $67.79. The $55.7 objective has become a bearish decision point because a sustained close below this will call for a decline toward the primary wave’s $51.7 target.

With that said, trading is expected to be erratic for at least another few days. During the past eight trading sessions each time the market looks like it will fall it rises, and vice versa. Therefore, caution is warranted.
Should WTI crude oil hold $59.8 and overcome $61.6 early tomorrow, the head and shoulders pattern will likely fail (it could still transmute into a complex head and shoulders provided $61.6 holds). In this case, look for a test of $62.7 and possibly $63.9. The $63.9 level is a bullish decision point because this is the 62 percent retracement of the decline from $67.79 and is near the larger than (1.618) target of the primary wave up from $57.25. Settling above $63.9 would imply the corrective move down is complete and open the way for $64.6 and likely higher.
This is a brief analysis for the next day or so. Our weekly Crude Oil Forecast and daily updates are much more detailed and thorough energy price forecasts that cover WTI, Brent, RBOB Gasoline, Diesel, and spreads. If you are interested in learning more, please sign up for a complimentary four-week trial.


