WTI Crude Oil Price Forecast
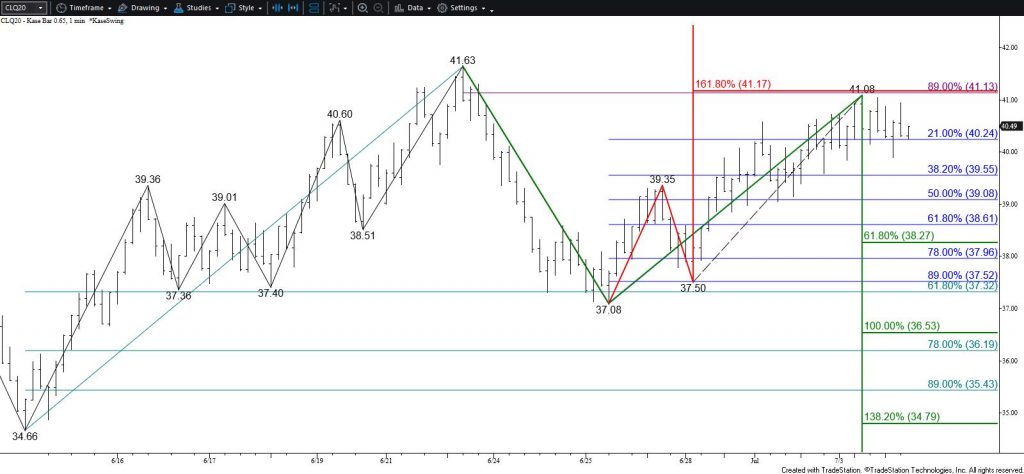
The long-term outlook for WTI crude oil is bullish. However, prices are struggling to overcome a crucial target at $41.2. This is a highly confluent projection for the waves and sub-waves up from $20.28 and the larger than (1.618) target of the primary wave up from $37.08 on the August chart. Most importantly, $41.2 is in line with the March 9 gap down from $41.05 on the continuation chart. So far $41.2 has held on a closing basis. Settling above this will clear the way for $42.2 and likely a push to targets in the range of $43.6 to $45.0.

Nevertheless, Monday’s high-wave candlestick and today’s hanging man pattern reflect uncertainty and a rising degree of hesitance to rise above $41.2. These patterns also suggest another test of support might take place first. Any move down will most likely prove to be corrective. Should WTI fall below $39.6, look for a test of key near-term support at $38.5. This is split between the 62 percent retracement of the move up from $37.08 and the smaller than (0.618) target of the wave down from $41.63. Settling below $38.5 is doubtful but would call for $38.0 and likely $36.5, the latter of which is the equal to (1.00) target.
Brent Crude Oil Price Forecast
Brent has held $43.8 so far this week. This is the last target protecting the $43.97 swing high. Odds still favor an eventual close above $43.8, which will open the way for $44.6 and higher. However, Monday’s shooting star and today’s high wave candlestick suggests a test of $42.2 and possibly $41.1 might take place first. Support at $41.1 is key and is expected to hold. Closing below $41.1 will call for a deeper correction to $40.1 and likely $39.4 before the move up continues.
This is a brief analysis for the next day or so. Our weekly Crude Oil Forecast and daily updates are much more detailed and thorough energy price forecasts that cover WTI, Brent, RBOB Gasoline, Diesel, and spreads. If you are interested in learning more, please sign up for a complimentary four-week trial.


