Traders are reportedly waiting for more information regarding the tentative OPEC deal to cut crude oil production before making up their minds about whether to be bullish. Some pundits say that until the deal is confirmed next month, crude oil prices may continue to soften. A stronger U.S. dollar also reportedly weighed on crude oil prices late last week. However, the dollar has formed a daily evening star setup that suggests it may pull back a bit before rising again.
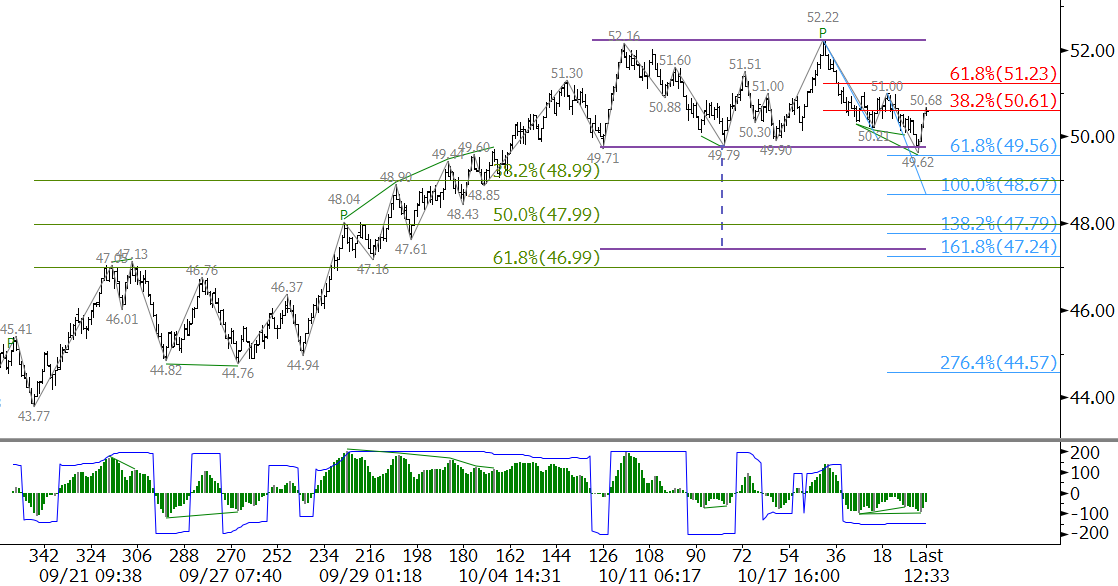
Last week, December WTI formed a pseudo double top at nominally $52.19 (highs of $52.16 and $52.22). The pattern’s confirmation point is the $49.79 swing low. On Monday, December fell to $49.62 but was unable to confirm the double top with a close below $49.79.
The rally into Monday’s settle confirmed bullish KasePO momentum divergence on the $0.35 Kase Bar chart. It also setup a daily morning star and hammer setup. This candlestick pattern indicates a test of last Thursday’s $51.1 midpoint should take place Tuesday. This is a very important level for the near-term. $51.1 is also in line with an intra-day $51.0 swing high and the 62 percent retracement of the decline from $52.22 to $49.62. A close over $51.1 would call for $51.6 and possibly for the $52.19 double top to be challenged again.
That said, while $51.1 holds, there is still a good chance for the move down to extend because the double top is still intact. A close below $49.79 would confirm the double top and open the way for $49.3 and lower.
This is a brief analysis and outlook for the next day or so. Our weekly Crude Oil Commentary and intra-week updates are a much more detailed and thorough energy price forecast. If you are interested in learning more, please sign up for a complimentary four-week trial.


