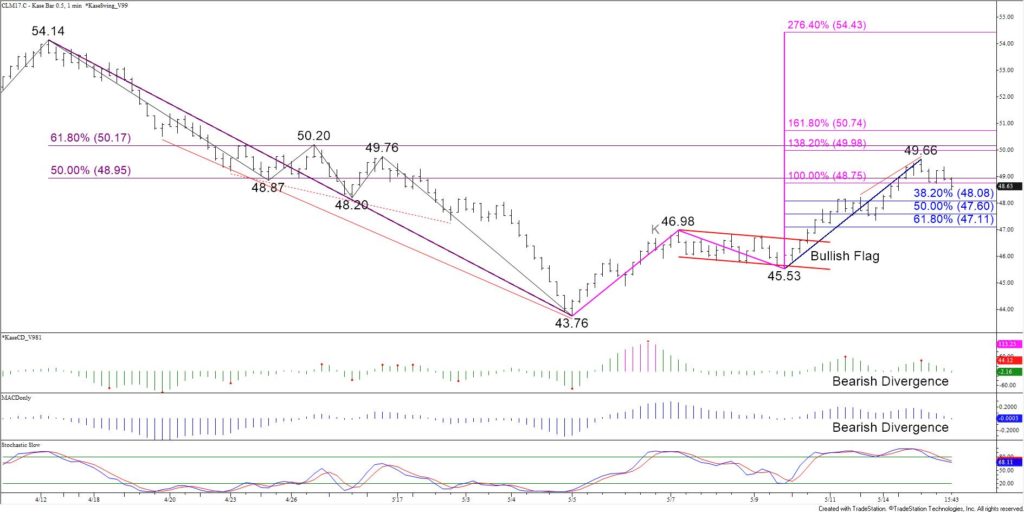
Last Wednesday, June WTI broke higher out of the intraday bullish flag discussed in the crude oil forecast. The subsequent move up overcame the 0.618 and 1.00 projections of the wave $43.76 – 46.98 – 45.53. However, June stalled at $49.66 before meeting key resistance at $50.1. This is the confluence point between the 1.382 projection and the 62 percent retracement of the decline from $54.14 to $43.76.
Ultimately, June WTI should challenge $50.1. A sustained close over this would be a strong indication the larger scale move down is over, for now. However, bearish KaseCD and MACD divergences on the $0.50 Kase Bar chart call for a test of support first.

So far, the decline from $49.66 has been reasonably shallow and choppy, indicating it is most likely corrective of the move up. Today, June settled below the 0.618 projection of the wave $49.66 – 48.73 – 49.38 and met the 1.00 projection at $48.5. Meeting the 1.00 projection means the correction may already be complete. However, until prices rise above the $49.38 swing high, odds favor a deeper correction to $48.1 and possibly $47.1.
If the move up is going to continue to $50.1 this week, $47.1 must hold. This is the 62 percent retracement of the move up from $45.53 to $49.66. A close below $47.1 would call for a deeper test of support and possibly for June to challenge the crucial $45.53 swing low.
This is a brief analysis and outlook for the next day or so. Our weekly Crude Oil Commentary and daily updates are much more detailed and thorough energy price forecasts that cover WTI, Brent, RBOB Gasoline, Diesel, and spreads. If you are interested in learning more, please sign up for a complimentary four-week trial.


