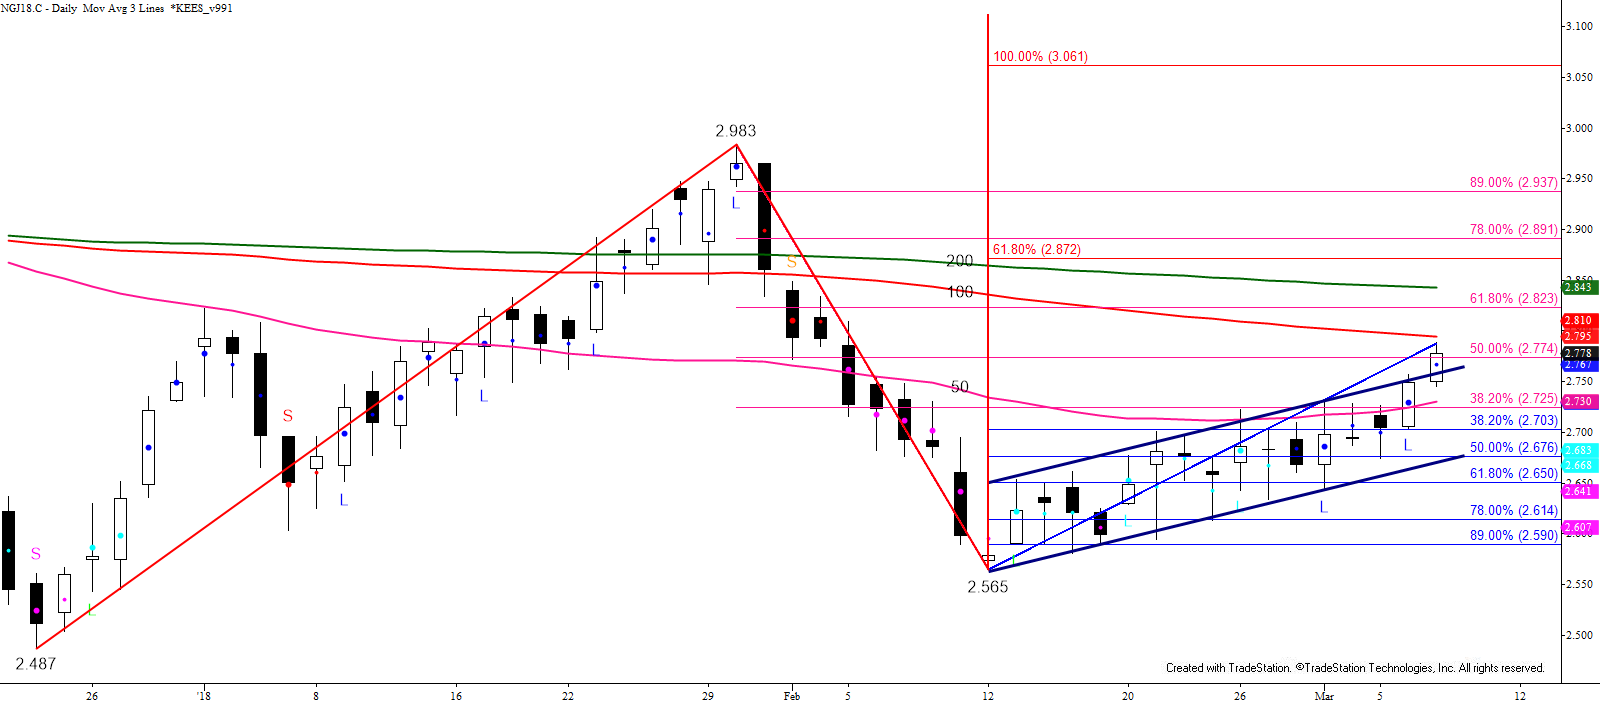
Since February 12, April natural gas had risen in a choppy upward sloping range that formed a bearish flag. However, prices broke higher out of the flag today and settled above the pattern’s upper trend line. The flag’s failure to break lower is bullish for the near-term and calls for a larger upward correction before the move down ultimately continues.
The next objective is $2.80, which is the 100-day moving average and a confluent projection for the multitude of waves and sub-waves that formed the flag. A close above this would call for $2.83 and possibly $2.87.
The $2.83 target is a potential stalling point because it is in line with the 62 percent retracement of the decline from $2.983 and the 200-day moving average. If the move up is going to remain a “normal” correction, $2.83 should hold.

Key resistance is $2.87. This is the smaller than (0.618) target for April natural gas’ wave $2.487 – 2.983 – 2.565. Waves that meet the smaller than target typically extend to the equal to (1.00) target, in this case, $3.06. Therefore, should April settle above $2.87 look for prices to rise above $3.00 again.
All of that said, the long-term outlook for natural gas remains negative, and even a move above $2.87 will do little to dampen that. For now, though, support at $2.70 should hold and key support is $2.65. These are the 38 and 62 percent retracements of the move up from $2.565, so far. A close below $2.65 would shift near-term odds back in favor of a continued decline to challenge major support in the low $2.50’s.
This is a brief analysis for the next day or so. Our weekly Natural Gas Commentary and daily updates are much more detailed and thorough energy price forecasts that cover key natural gas futures contracts, calendar spreads, the UNG ETF, and several electricity contracts. If you are interested in learning more, please sign up for a complimentary four-week trial.


