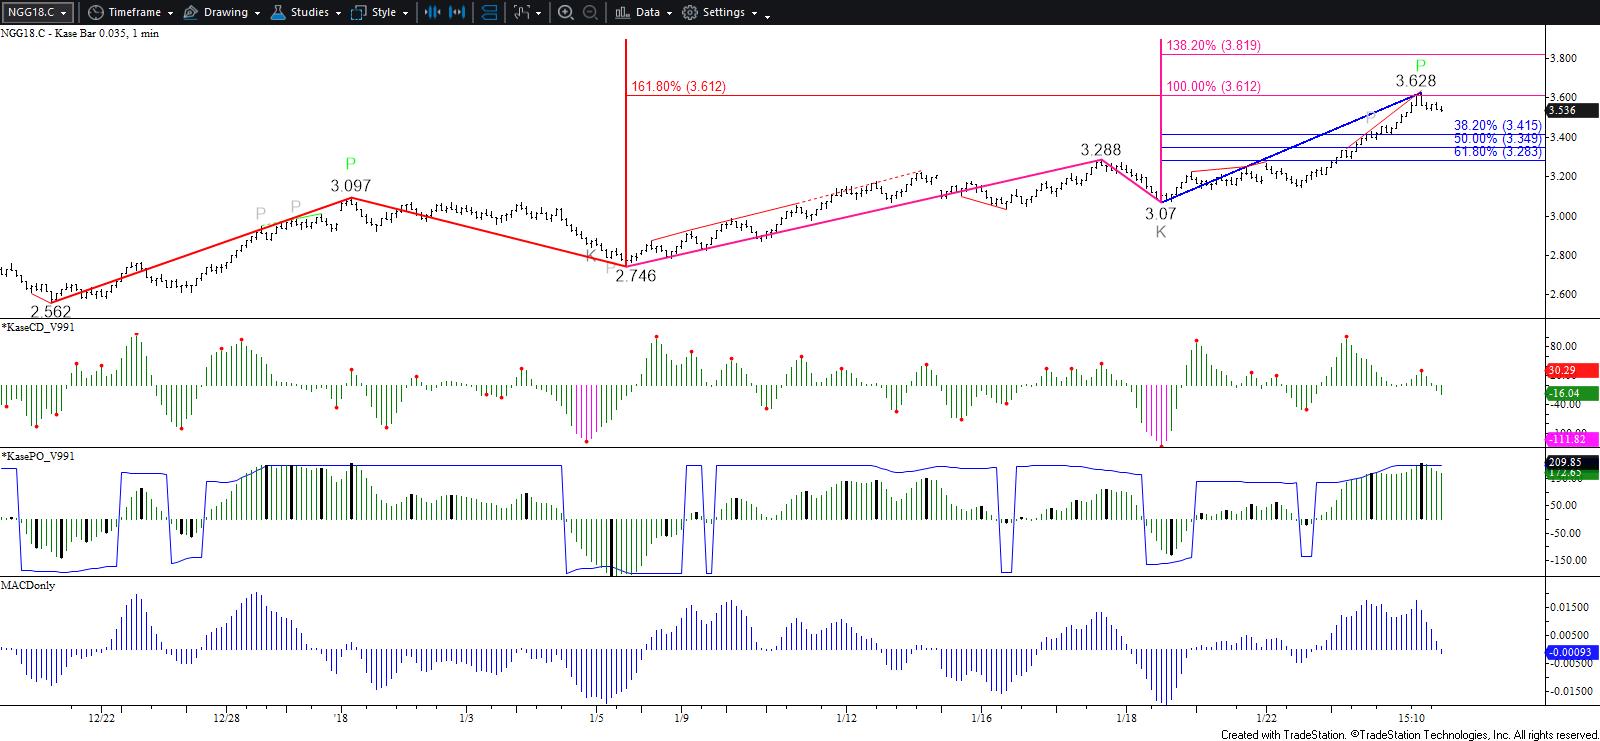
February natural gas finally broke through $3.32, the upper end of the confluence range around $3.29 +/- $0.03 discussed for the past few weeks. Although the day officially settled at $3.444, prices surged higher after the settlement to $3.628 and fulfilled the larger than (1.618) target of the wave $2.562 – 3.097 – 2.746 and the equal to (1.00) target of the wave $2.746 – 3.288 – 3.07. The confluence and importance of targets in this area make $3.628 a potential stalling point.
That said, it is difficult to call for the move up to stall after such a strong rally. Odds favor a continued rise and a move above $3.59 in early trading will open the way for $3.65 and higher.

Even so, bearish intra-day divergences, a PeakOut (overbought signal), and the small wave down from $3.628 indicate a pullback to $3.48 and possibly $3.42 will probably take place first. Support at $3.42 should hold. Key support is $3.35, today’s open-close midpoint and the 50 percent retracement of the move up from $3.07. A close below this would confirm the move up has stalled, at least temporarily, and call for a test of $3.25, today’s open and the 200-day moving average.
The bottom line is that trading may become extremely volatile over the next few days and even weeks as the market sorts through the extent of the effects of external factors (i.e. developing polar vortex in February). If the market’s outlook is going to remain bullish through the end of winter, it will have to hold support above at least $3.25 and likely $3.35.
This is a brief analysis for the next day or so. Our weekly Natural Gas Commentary and daily updates are much more detailed and thorough energy price forecasts that cover key natural gas futures contracts, calendar spreads, the UNG ETF, and several electricity contracts. If you are interested in learning more, please sign up for a complimentary four-week trial.


