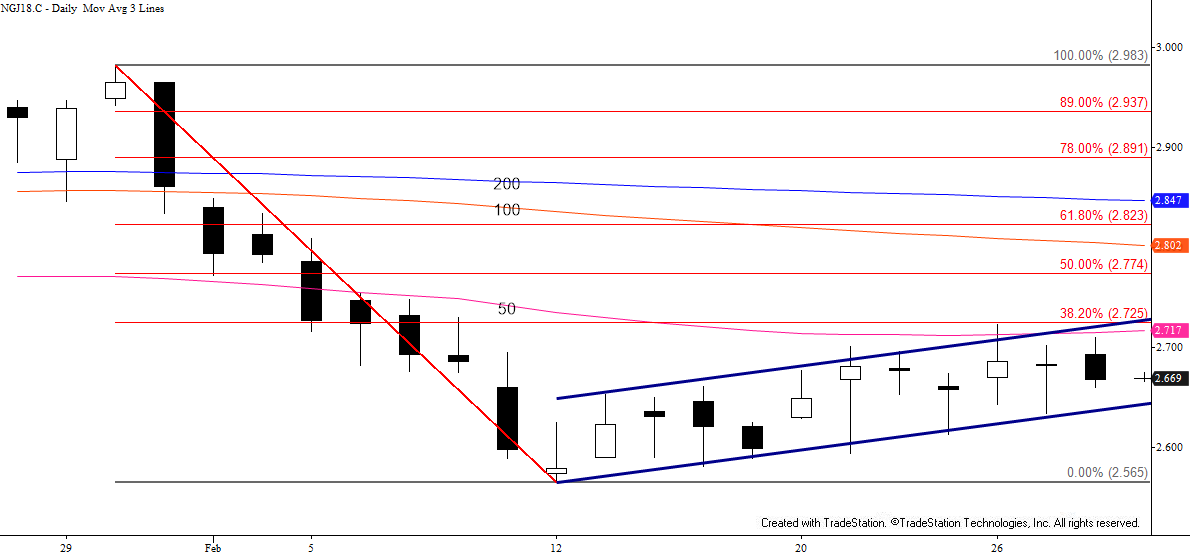
The outlook for April natural gas remains negative. Prices are still oscillating within the upward sloping bearish flag, but today’s failure to test the top of the flag’s range at $2.73 indicates the formation should attempt to break lower tomorrow.
The flag’s lower trend line is nominally $2.64, but $2.63 is key because it is the 62 percent retracement of the move up from $2.565. It is also in line with the $2.633 swing low. A close below $2.63 will confirm the flag has broken lower and open the way for another test of $2.52, the gateway to a much more bearish long-term outlook.

Resistance at $2.73 should hold. This is near the top of the flag, the 50-day moving average, and the 38 percent retracement of the decline from $2.983. A close above this would call for a larger upward correction that could ultimately reach $2.84.
The $2.84 threshold is most important because it is split between the 62 percent retracement and the 200-day moving average. It is doubtful that prices will overcome (or even reach) $2.84 without significant help from external factors.
This is a brief analysis for the next day or so. Our weekly Natural Gas Commentary and daily updates are much more detailed and thorough energy price forecasts that cover key natural gas futures contracts, calendar spreads, the UNG ETF, and several electricity contracts. If you are interested in learning more, please sign up for a complimentary four-week trial.


