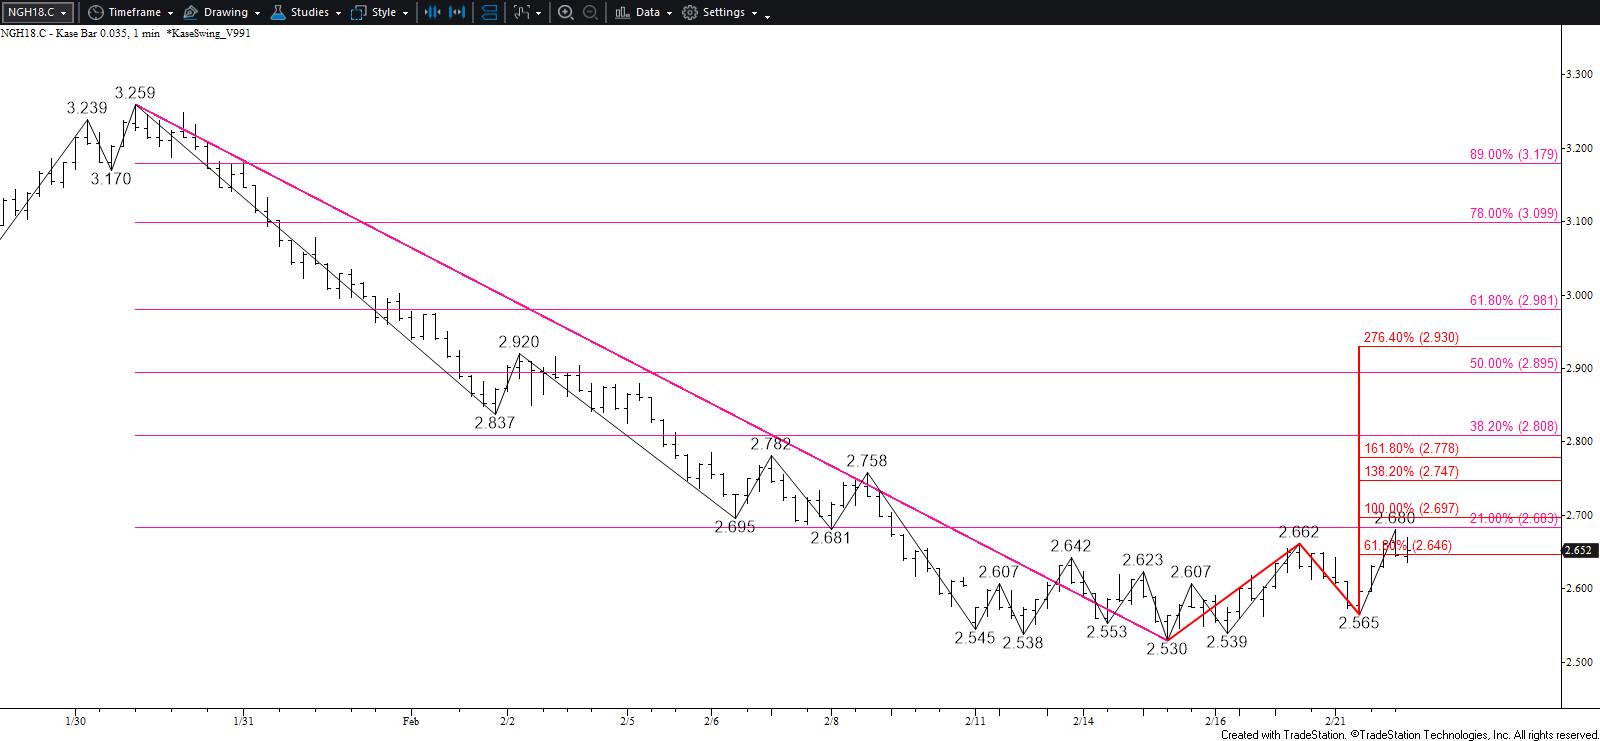
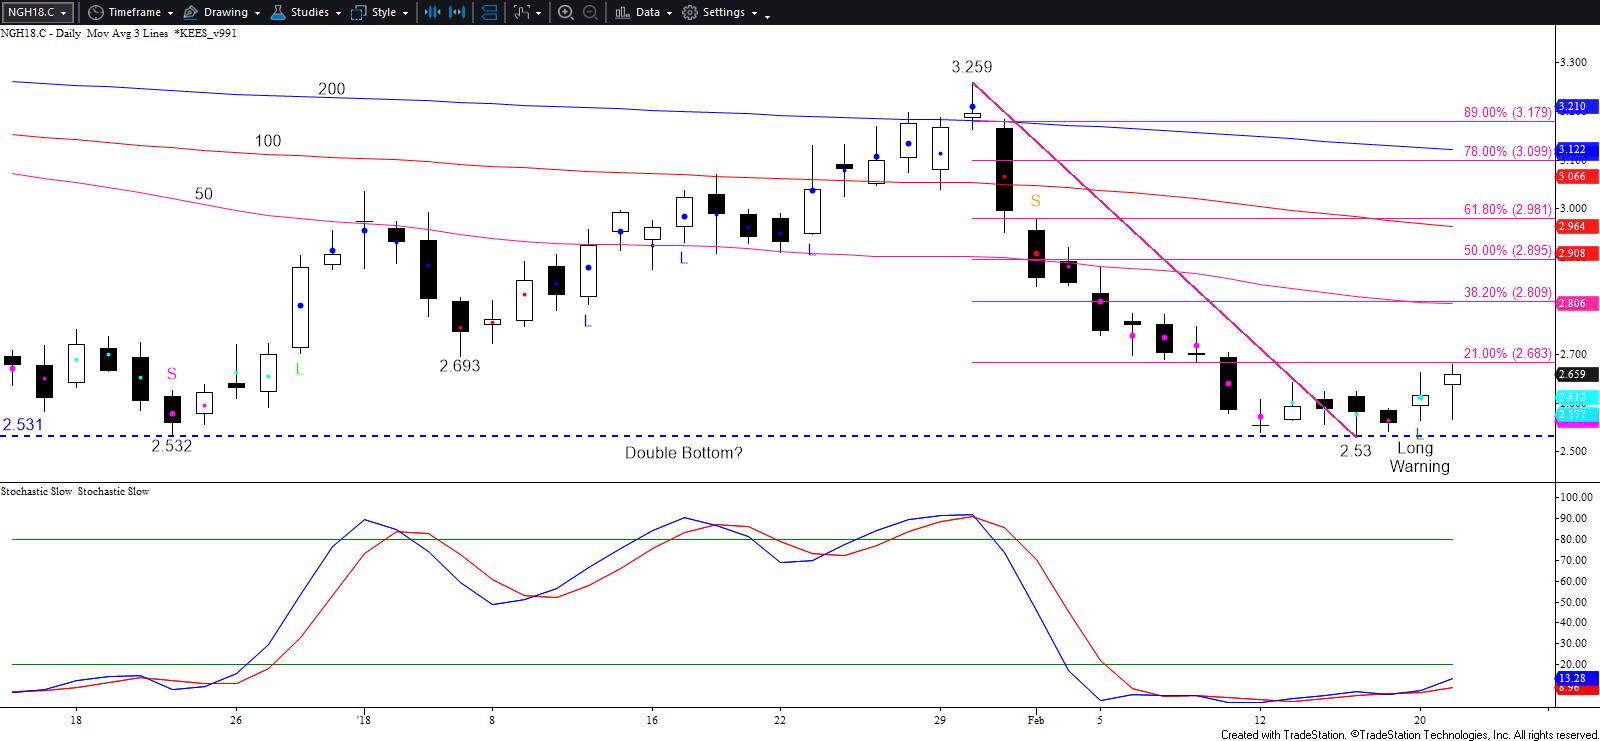
March natural gas finally settled above February’s 9’s $2.64 midpoint. The move up is most likely corrective of the decline from $3.259 and will continue to be a grind. However, natural gas should now challenge at least $2.71 and possibly higher before the decline ultimately continues.
The wave $2.53 – 2.662 – 2.565 met its $2.65 smaller than (0.618) target today. Waves that meet the smaller than target typically extend to the equal to (1.00) target, in this case, $2.71. This is an important objective because $2.71 is also in line with February 9’s open and is the completion point of the weekly morning star setup.

Settling above $2.71 would call for a larger upward correction and test of key near-term resistance at $2.81. This is the 38 percent retracement of the decline from $3.259 and the 50-day moving average. For the move down to continue in the near-term $2.81 must hold. A sustained close above this would not doom the move down, but rather dampen the odds for a continued decline to targets below the continuation chart’s crucial $2.522 swing low over the next few weeks.

Initial support is $2.61 and key support for the next few days is the $2.565 swing low. A move below this would wipe out the aforementioned wave up from $2.53 that projects to $2.71 and higher. This would also shift near-term odds back in favor of testing $2.51 and lower.
This is a brief analysis for the next day or so. Our weekly Natural Gas Commentary and daily updates are much more detailed and thorough energy price forecasts that cover key natural gas futures contracts, calendar spreads, the UNG ETF, and several electricity contracts. If you are interested in learning more, please sign up for a complimentary four-week trial.


