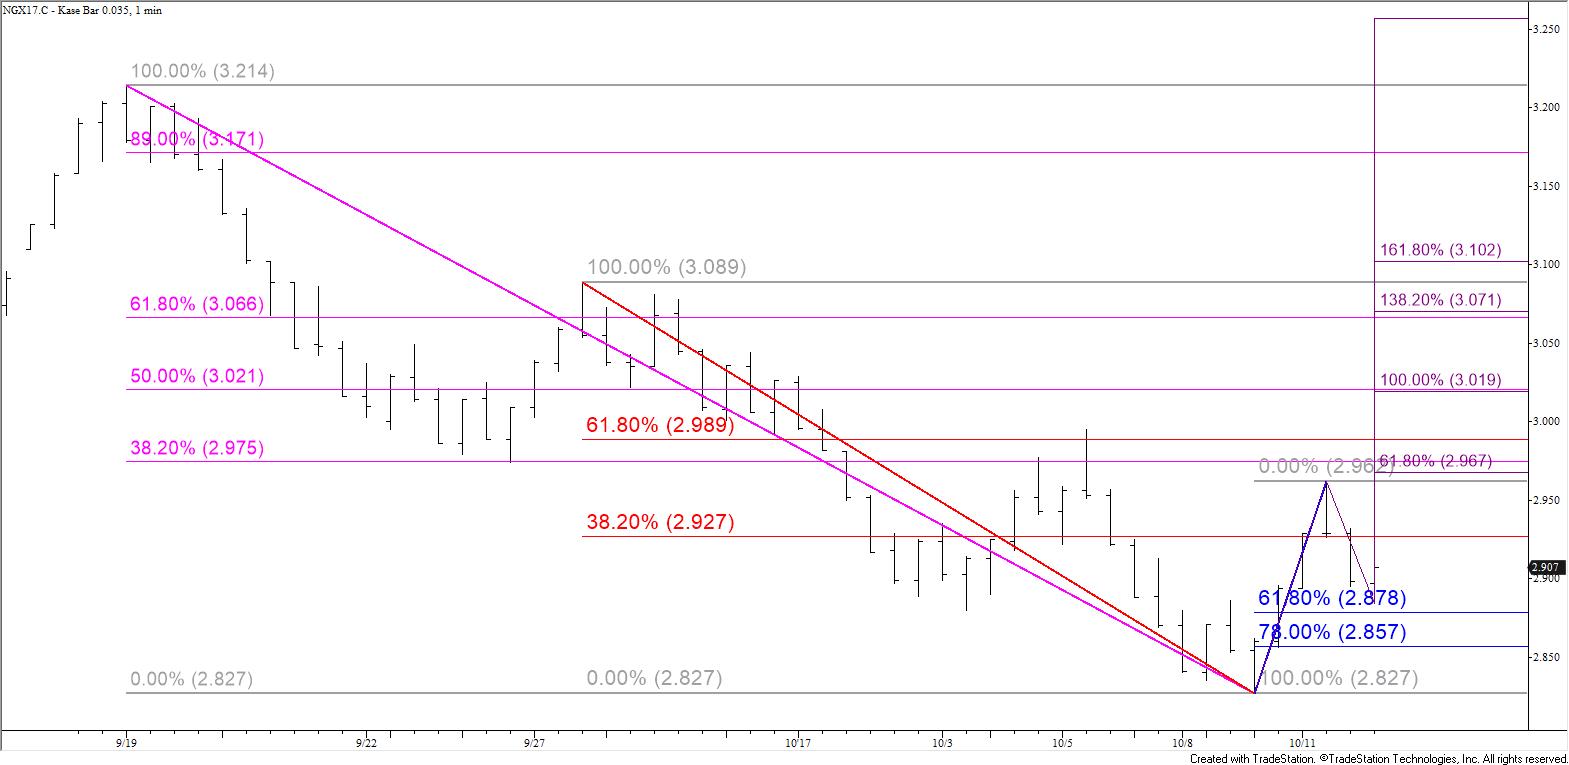
November natural gas overcame $2.94 but could not settle above this highly confluent threshold. The pullback from $2.962 formed a long upper shadow on the daily chart. Patterns like this that have formed during the past few weeks have been early warnings that the corrective moves up have stalled. This is probably the case again, so odds favor a test of at least $2.86 tomorrow. A close below $2.86 would open the way for $2.82 and more likely $2.79. The key objective is $2.75, which is in line with the continuation chart’s $2.753 swing low.

That said, support at $2.88, the 62 percent retracement of the move up from $2.827, held this afternoon. Therefore, there is an outside chance that the move up will continue. A move above $2.93 in early trading would open the way for $2.97, which is now the smaller than (0.618) projection of the wave $2.827 – 2.962 – 2.884. This is also near the 38 percent retracement of the decline from $3.214 and the 62 percent retracement from $3.089. A close above $2.97 would call for $3.02, the equal to (1.00) projection, 50 percent retracement from $3.214, and 50-day moving average.
This is a brief analysis for the next day or so. Our weekly Natural Gas Commentary and daily updates are much more detailed and thorough energy price forecasts that cover key natural gas futures contracts, calendar spreads, the UNG ETF, and several electricity contracts. If you are interested in learning more, please sign up for a complimentary four-week trial.


