Natural Gas Technical Analysis and Near-Term Outlook
This is a brief analysis for the next day or so. Our weekly Natural Gas Commentary and daily updates are much more detailed and thorough energy price forecasts that cover key natural gas futures contracts, calendar spreads, the UNG ETF, and several electricity contracts. If you are interested in learning more, please sign up for a complimentary four-week trial.
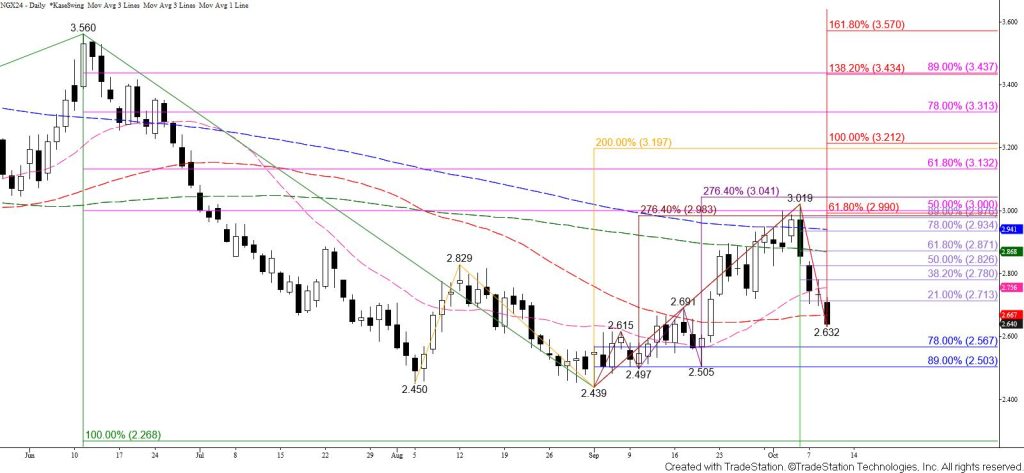
November natural gas closed below the 62 percent retracement of the rise from $2.439 and the 50-day moving average today. This strongly suggests that November’s move up from $2.439 is complete. The move down is now poised to test a confluent but relatively minor target at $2.61 and then an important objective at $2.58. The $2.58 target is in line with the 78 percent retracement of the rise from $2.439 and is the 38 percent retracement of the rise from $1.856 on the continuation chart. A normal correction of the move up from $1.856 on the continuation chart will hold $2.58. Settling below this will clear the way for tests of $2.52 and $2.46 in the coming days.
There are no bullish patterns, signals, or setups that call for the move down to stall. Even so, should prices rise tomorrow look for resistance at today’s $2.68 midpoint and the $2.71 open. Key resistance for the near-term outlook is the 38 percent retracement of the decline from $3.019 at $2.78.


