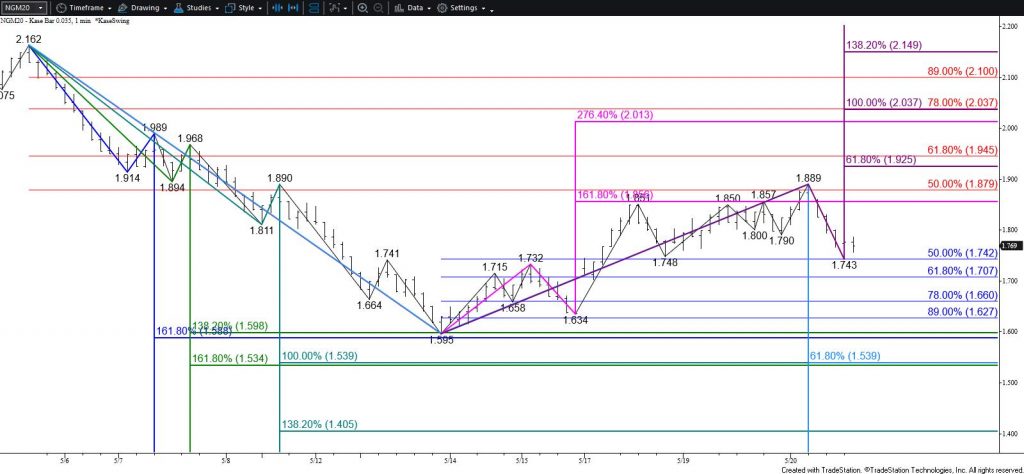
During the past few days June natural gas has risen to challenge the lower trend line of the bearish flag pattern that prices broke lower out of on May 12. This is common after breaking lower out of this type of pattern. The pullback is most likely corrective and briefly overcame the lower trend line this morning. The trend line is also in the vicinity of the 21- and 50- day moving averages and a few crucial wave projections and the 50 percent retracement of the decline from $2.162. All of these levels held on a closing basis. The subsequent move down left a long upper shadow on the daily candlestick and retraced 50 percent of the move up from $1.595.

Today’s price action was bearish for the outlook during the next few days and calls for a test at least $1.71. This is the 62 percent retracement of the move up from $1.595, a close below which will significantly increase odds for another attempt at $1.59. The $1.59 objective is still a relatively confluent and important target that could hold. However, settling below this would call for $1.55, which is now the last level of support protecting the $1.519 swing low on the continuation chart.
The decline from $1.889 lacks a definitive wave structure, so a test of resistance might take place early tomorrow. Resistance at $1.83 is expected to hold. Key resistance is $1.87. Settling above this would put prices back above the flag’s lower trend line and call for a push toward $1.92, which then connects to $2.02. This is doubtful but would reflect a bullish shift in fundamental factors and near-term sentiment.
This is a brief analysis for the next day or so. Our weekly Natural Gas Commentary and daily updates are much more detailed and thorough energy price forecasts that cover key natural gas futures contracts, calendar spreads, the UNG ETF, and several electricity contracts. If you are interested in learning more, please sign up for a complimentary four-week trial.


