Natural Gas Technical Analysis and Near-Term Outlook
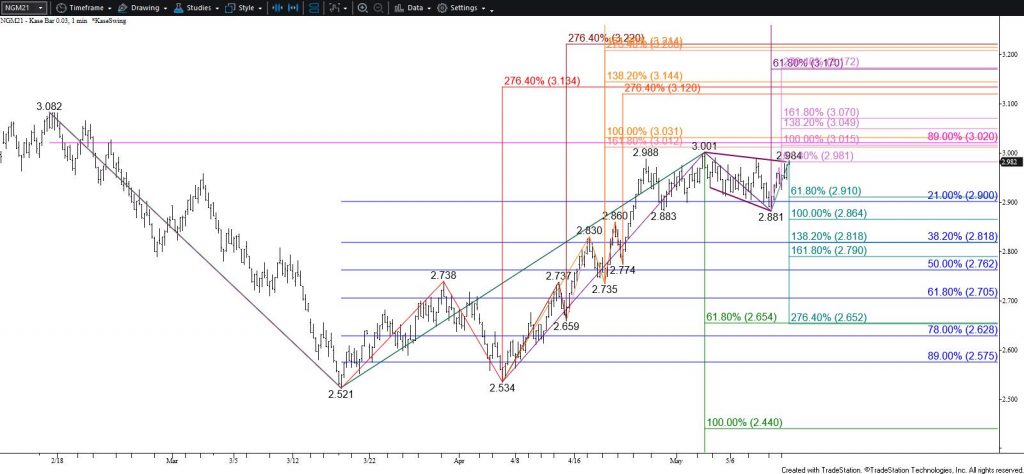
Natural gas has been trading in a very indecisive manner for the past few weeks. A complex head and shoulders pattern has taken shape and would be confirmed by a close below $2.88. However, this pattern looks as though it will fail because the right side of the head and shoulders forms a bullish expanding wedge. June natural gas is challenging the upper trend line of this pattern this afternoon. Moreover, the small intraday wave up from $2.881 met its smaller than (0.618) target this afternoon and is now poised to reach $3.02. This is the most confluent target on the chart, so $3.02 could prove to be another stalling point. However, closing above $3.02 will clear the way for $3.07 and likely $3.13.

Nevertheless, the top of the right shoulder of the head and shoulders pattern at $2.989 has held as of this analysis (marginally). Should June natural gas take out $2.95 early tomorrow look for a test of $2.91, which then connects to $2.86. Closing below $2.86 would also take out the $2.88 neckline of the head and shoulders and shift near-term odds in favor of a deeper test of support.
This is a brief analysis for the next day or so. Our weekly Natural Gas Commentary and daily updates are much more detailed and thorough energy price forecasts that cover key natural gas futures contracts, calendar spreads, the UNG ETF, and several electricity contracts. If you are interested in learning more, please sign up for a complimentary four-week trial.


