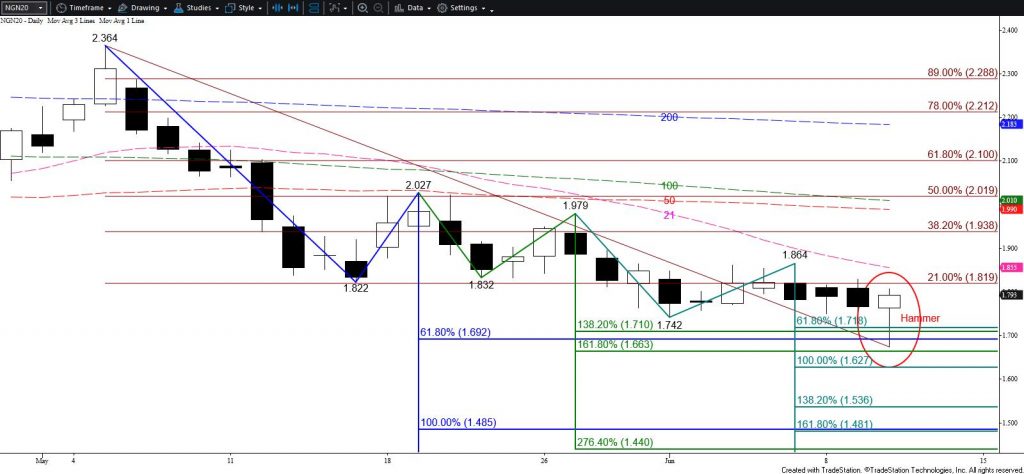
Natural gas fell as called for and finally challenged the crucial $1.69 objective. However, the move down stalled just below $1.69 at $1.674 and then quickly rallied. This formed a spike type bottom on the intra-day chart and a textbook daily hammer. The brevity of the move down felt as though the market needed to get a test of $1.69 out of its system before rising to challenge resistance again.

Today’s prices action, the hammer, and several momentum oscillator divergence setups call for a larger test of resistance during the next few days. Closing above $1.81 will confirm the hammer and clear the way for key near-term resistance at $1.86. Resistance between $1.86 and $1.90 has been resilient on the July and continuation charts for the past few weeks. Therefore, closing above $1.86 would confirm a bullish shift in near-term sentiment and increase odds for a test of $1.94 and $2.00.
Nonetheless, for now, the move up is corrective and must hold $1.69 on a closing basis. Should natural gas fall below $1.75 early tomorrow look for another attempt at $1.69. Settling below $1.69 would be quite bearish and open the way for $1.61 and possibly lower.
This is a brief analysis for the next day or so. Our weekly Natural Gas Commentary and daily updates are much more detailed and thorough energy price forecasts that cover key natural gas futures contracts, calendar spreads, the UNG ETF, and several electricity contracts. If you are interested in learning more, please sign up for a complimentary four-week trial.


