Natural Gas Price Forecast
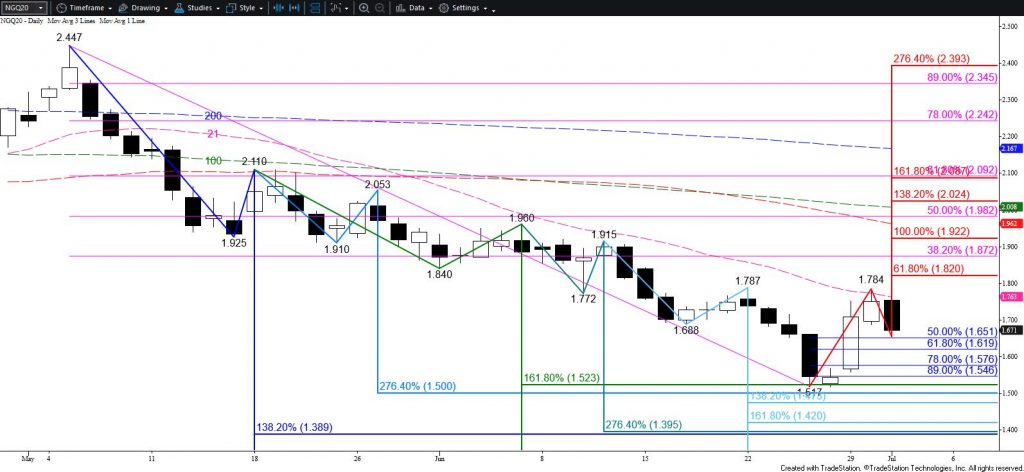
After prompt month natural gas prices fell to a 25 year low of $1.432 late last week prices quickly bounced to challenge important resistance at $1.77. A move like this is common after such a significant decline but does not necessarily mean a bottom has been made.
So far, resistance at $1.77 has held on a closing basis. This level is still a factor because it is August’s 21-day moving average and the 50- and 100-day moving average on the continuation chart. Also, today’s bearish engulfing line and the intra-day waves down from $1.784 call for a deeper test of support. Tomorrow, look for a test of $1.62, a close below which will call for $1.55 and possibly $1.51.

Nevertheless, should $1.62 hold and prices settle above $1.77, there is a good chance that a bottom has been made and that prices are settling back into a trading range for the interim. In this case, natural gas should rise toward major resistance at $1.87. For now, unless there is a bullish shift in supply/demand factors, $1.87 is expected to hold.
This is a brief analysis for the next day or so. Our weekly Natural Gas Commentary and daily updates are much more detailed and thorough energy price forecasts that cover key natural gas futures contracts, calendar spreads, the UNG ETF, and several electricity contracts. If you are interested in learning more, please sign up for a complimentary four-week trial.


