Natural Gas Technical Analysis and Near-Term Outlook
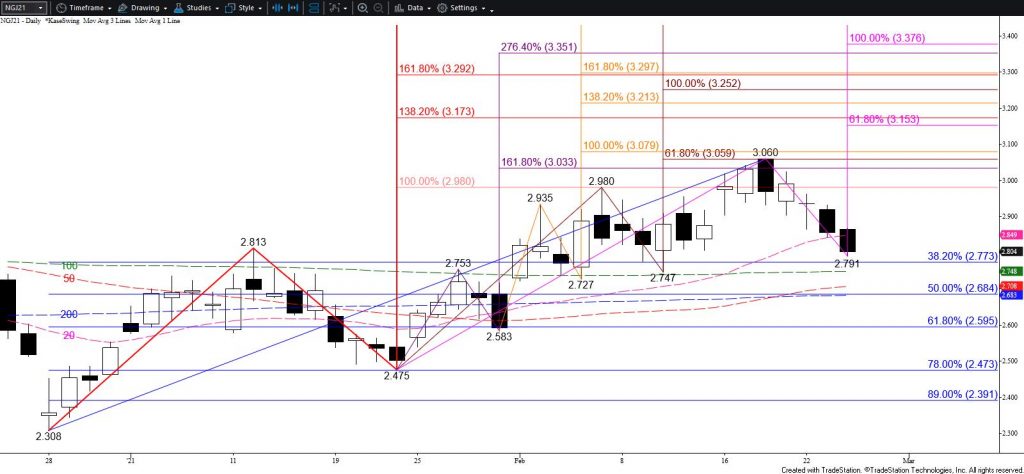
Natural gas fell again today as expected and settled below the $2.80 target called for in Tuesday’s update and the 20-day moving average. The decline from $3.06 is now poised to test a crucial target at $2.76. This is the larger than (1.618) target of the primary wave down from $3.06 and is split between the 38 percent retracement of the rise from $2.308 and the 100-day moving average. This might prove to be stingy near-term support, especially in the case that tomorrow’s reported withdrawal is larger than expected. Nevertheless, the charts can only tell us what the market currently knows about itself. Based on this week’s decline, it looks as though the market is shaking off last week’s cold snap. Therefore, upon a close below $2.77 look for $2.69 and $2.60.

That said, caution is still warranted because a miss in either direction by consensus expectations for tomorrow’s storage report could quickly drive prices much higher or lower. At this point, there is probably more upside risk than downside too. Therefore, should natural gas overcome $2.89 look for a test of key near-term resistance at $2.96. Closing above this would reflect renewed bullish sentiment and warn that the move down might be complete. Closing above $3.03 would confirm this and clear the way for $3.08 and higher. Keep in mind that April’s primary wave up from the $2.07 contract low still favors an eventual rise to fulfill its $3.29 equal to (1.00) target, which is also the larger than target of the initial wave up from $2.308.
This is a brief analysis for the next day or so. Our weekly Natural Gas Commentary and daily updates are much more detailed and thorough energy price forecasts that cover key natural gas futures contracts, calendar spreads, the UNG ETF, and several electricity contracts. If you are interested in learning more, please sign up for a complimentary four-week trial.


