Natural Gas Technical Analysis and Near-Term Outlook
This is a brief analysis for the next day or so. Our weekly Natural Gas Commentary and daily updates are much more detailed and thorough energy price forecasts that cover key natural gas futures contracts, calendar spreads, the UNG ETF, and several electricity contracts. If you are interested in learning more, please sign up for a complimentary four-week trial.
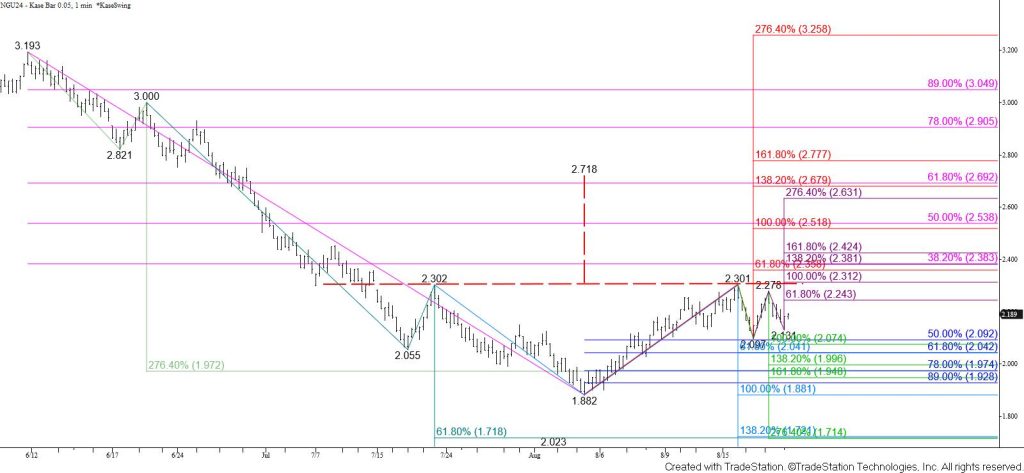
A sustainable bullish reversal is likely underway for natural gas. Confirmed weekly bullish KasePO, RSI, and MACD divergence signals and a bullish weekly KCDpeak (oversold signal) call for a much more substantial test of resistance. Such a move will be confirmed by a close above the $2.30 neckline of an inverted head and shoulders pattern. The target of the inverted head and shoulders pattern is $2.72. This objective is also in line with the intermediate (1.382) target of the wave up from $1.882 and the 62 percent retracement of the decline from $3.193.
For the outlook in the coming days, closing above the $2.24 smaller than (0.618) target of the wave up from $2.097 will call for a test of this wave’s equal to (1.00) target, which is in line with the $2.30 neckline. Settling above $2.30 will open the way for a highly confluent $2.37 target that connects to $2.42 and higher.
That said, there is still potential for the right shoulder of the inverted head and shoulders pattern to extend. The wave down from $2.301 took out its $2.15 smaller than target today. This suggests that this wave will test its $2.07 equal to target before prices rise to challenge the $2.30 neckline. The $2.07 level is expected to hold. Closing below this will warn that the move up is failing and call for a test of key support at $2.04. The right shoulder would remain intact should $2.04 hold. Settling below this would negate the pattern and shift the odds in favor of natural gas falling to $2.00 and lower.


