By Dean Rogers
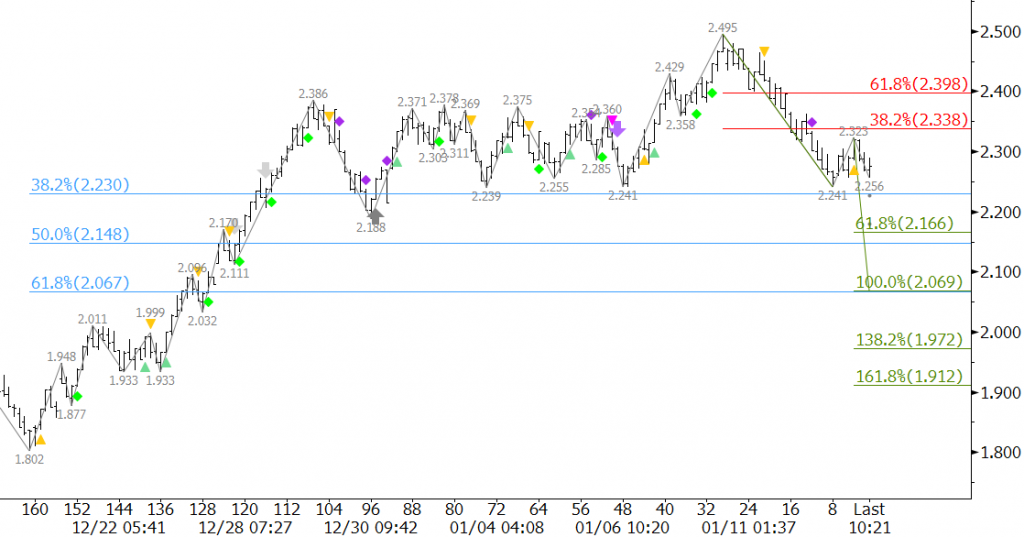
Natural gas fell back into the trading range between $2.23 and $2.39 where it spent the first week of the new year. This comes after the failure to extend to the 0.618 projection of the wave $1.802 – 2.386 – 2.188. There is still an outside chance the move up will extend to $2.56 while $2.188 holds, but overall, the charts do not look good and odds favor a decline to test major support.
The move down from $2.495 broke down into five waves that terminated near $2.241. Today’s small move up to $2.323 was the type of three-wave correction that would be expected after a five-wave pattern. This keeps short-term odds in favor of the decline below key support at $2.23. Upon a close below $2.23 look for $2.17, the 0.618 projection of the wave $2.495 – 2.241 – 2.323. This then connects to $2.07 as the 1.00 projection. These are also the 50 and 62 percent retracements of the move up from $1.802 to $2.495, respectively.

Today’s Harami line and star setup is positive, but the star’s blow-off high dampens the likelihood of a turn higher tomorrow. A surprise bullish withdrawal reported by the EIA tomorrow morning could push prices higher, but based upon the price action for the past few days it looks as though most market participants expect the decline to continue.
This is a brief natural gas forecast for the next day or so. Our weekly Natural Gas Commentary is a much more detailed and thorough analysis. If you are interested in learning more, please sign up for a complimentary four-week trial.

