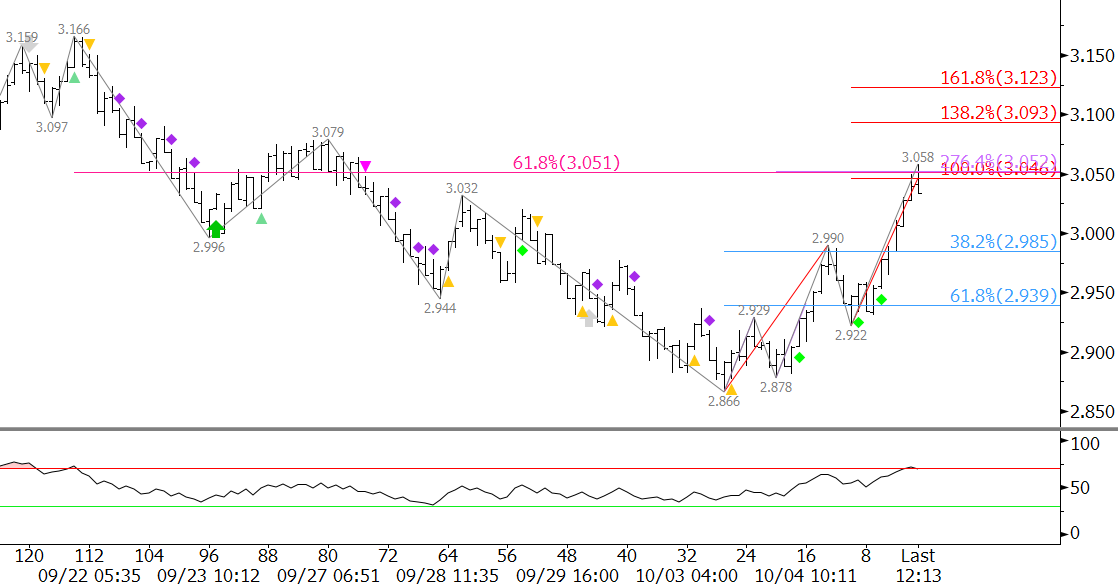
November natural gas has shown signs of strength over the past few days. November held support near $2.90 and on Tuesday completed a daily hammer when prices settled above $2.94. A bullish RSI divergence was confirmed at $2.866 on several intra-day charts. On Wednesday, the move up rallied to a very important $3.05 target ahead of the close. Finally, as of Wednesday, the weekly candlestick forms a bullish engulfing line.
These positive factors indicate the move up should continue to $3.09, $3.12, and possibly $3.18 over the next few days. A move to these targets would also take out the crucial $3.079 swing high. This would significantly dampen the odds for a continued decline to targets below $2.90.

That said, $3.05 is a potential stalling point. This is because $3.05 is the 62 percent retracement of the decline from $3.166 to $2.866 and the 1.00 projection of the wave $2.866 – 2.99 – 2.922. There are no definitive factors that indicate the move will stall at $3.05, but caution is warranted.
Should prices pullback from $3.05, support at $2.98 should hold. The key level for the near-term is $2.94. This is the 62 percent retracement of the move up from $2.866 to $3.058. A close below $2.94 would call for another test of the $2.866 swing low and most likely signal that a trading range is forming.
This is a brief natural gas forecast for the next day or so. Our weekly Natural Gas Commentary and intra-week updates provide a much more detailed and thorough analysis. If you are interested in learning more, please sign up for a complimentary four-week trial.


