By Dean Rogers
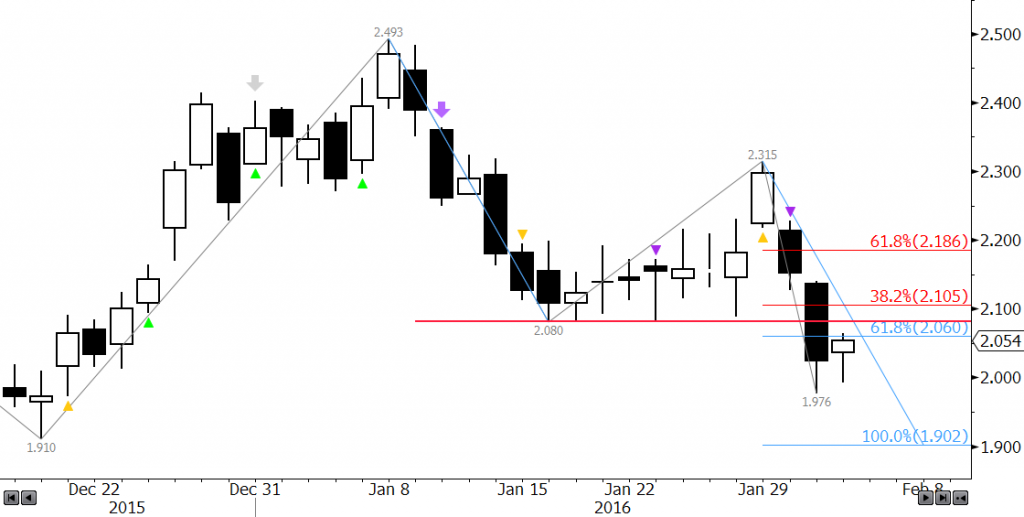
Many have already thrown in the towel on the prospects of a continued winter rally for natural gas. The negative sentiment was reflected on the charts earlier this week when prices plummeted from $2.315 after breaking higher out of the recent trading range between $2.08 and approximately $2.20. Trading will likely remain volatile, and yes, we should see a few more tests of resistance (as soon as tomorrow) as shifting weather reports predict potential cold spells in coming weeks. However, for now, and for the foreseeable future, this is still a bear market.
The majority of technical factors are negative and March natural gas finally closed below $2.08 support on Tuesday. Ultimately, the decline is poised to continue to at least $1.91. This is near the 1.00 projection of the wave $2.493 – 2.08 – 2.315, and is in line with the $1.91 contract low. First support is $1.99, and a close below this would indicate today’s small upward correction is over.

That said, there are a few factors that indicate today’s correction could extend before prices fall to $1.90. The psychologically important $2.00 level has held on a closing basis, and today’s price action formed a bullish Harami line and star setup on the daily chart. Resistance at $2.10, and maybe $2.18 could be tested first, though we expect the latter to hold.
This is a brief natural gas forecast for the next day or so. Our weekly Natural Gas Commentary is a much more detailed and thorough analysis. If you are interested in learning more, please sign up for a complimentary four-week trial.

