By Dean Rogers
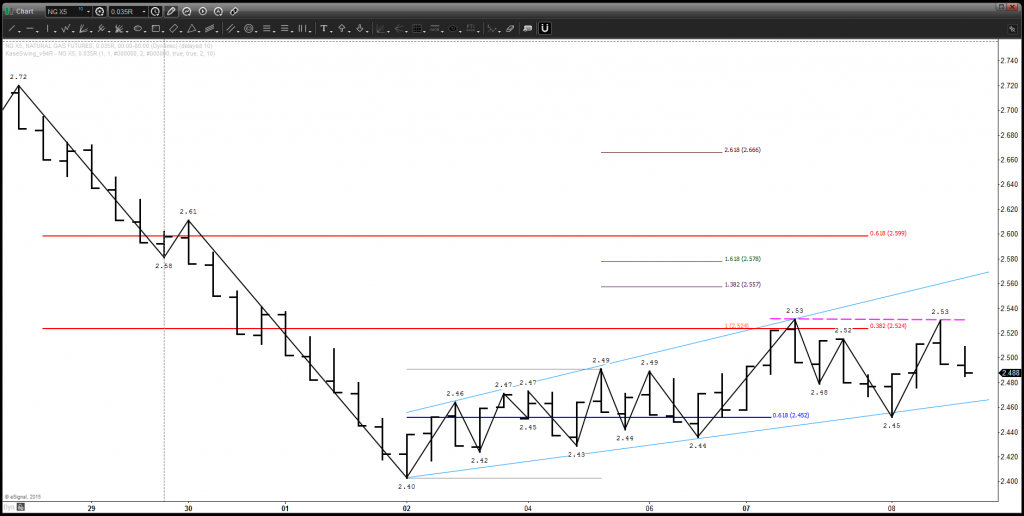
November natural gas had worked its way higher to challenge key resistance at $2.53 over the past few days after meeting major support at $2.403 last week. The move up has been shallow and choppy compared to the decline and could be interpreted as a bearish expanding wedge. The market also keeps giving back its intraday gains at the end of each day, which indicates hesitance to continue higher. This point is emphasized by the formation of an intraday double top at $2.53.
The completion point for the double top is $2.45, which is also in line with the wedges lower trend line. A close below this would confirm the double top and a break lower out of the wedge, opening the way for another test of $2.40 and possibly lower.
That said, a few positive factors, including bullish daily divergences and a morning star still show that the upward correction could extend to $2.60. The key for a move of this magnitude is for $2.45 to hold and a close over $2.53. The latter is the morning star’s confirmation point, the 1.00 projection for the wave $2.403 – 2.491 – 2.436, and the 38 percent retracement from $2.72 to $2.403.
On balance, with all factors considered, it is looking more and more like natural gas will settled into a trading range between $2.40 and $2.53 for a few weeks while awaiting external factors (weather) to sort out the direction for the next few months.
This is a brief natural gas forecast. Our weekly Natural Gas Commentary is a much more detailed and thorough analysis. If you are interested in learning more, please sign up for a complimentary four week trial.


