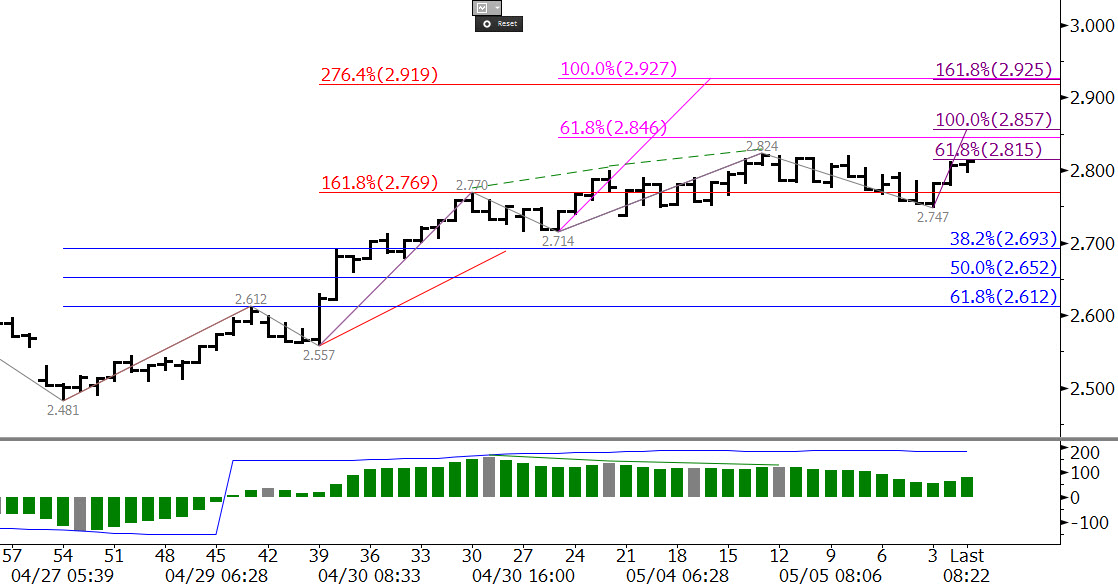
It is hard to deny the strength of the natural gas price rally over the past two weeks. Last week’s bullish engulfing line, April’s bullish hammer and morning star setup, and bullish daily divergences on the KasePO, KaseCD, MACD, RSI, and Stochastic are all technical evidence that the move down may finally be complete. However, many traders are skeptical of the move up and are asking what fundamental factors would support a recovery over the course of the longer-term. It is a fair and accurate question. Tomorrow’s U.S. Energy Information Administration (EIA) Natural Gas Weekly Update should provide a strong clue regarding the potential strength of a continued natural gas price rise.
In addition to the aforementioned bullish technical factors on the monthly, weekly, and daily charts, the short term technical factors and wave formations show evidence for a move to at least $2.93. This is a decision point because it is the 2.764 (XC – shown in red) projection for the wave up from $2.481, the 1.00 (E – shown in pink) from $2.557, and the 1.618 (L – shown in purple) from $2.747. In addition, $2.93 is the last level protecting mid-March’s $2.982 swing high. A sustained close over this would open the way for an extended move to targets above $3.00. However, $2.93 will not likely be tested until after tomorrow’s EIA report, if at all, because most traders are waiting for confirmation from another lower than expected build.

There is good reason to be suspicious of this move up, and a disappointing EIA report tomorrow could be the catalyst to turn prices lower again in very short order. Therefore, until there is a sustained close over $2.93 caution is warranted.
The daily chart has formed a hanging man and evening star setup as of this mid-day analysis, and a close below Monday’s $2.78 midpoint would complete the pattern. This would then open the way for $2.65, the 50 percent retracement of the move up and last week’s midpoint. A close below $2.65 would confirm the move up is over and most likely point toward the market settling into a trading range while it sorts itself out.
Request a trial of our weekly energy forecast on natural gas to learn more.

