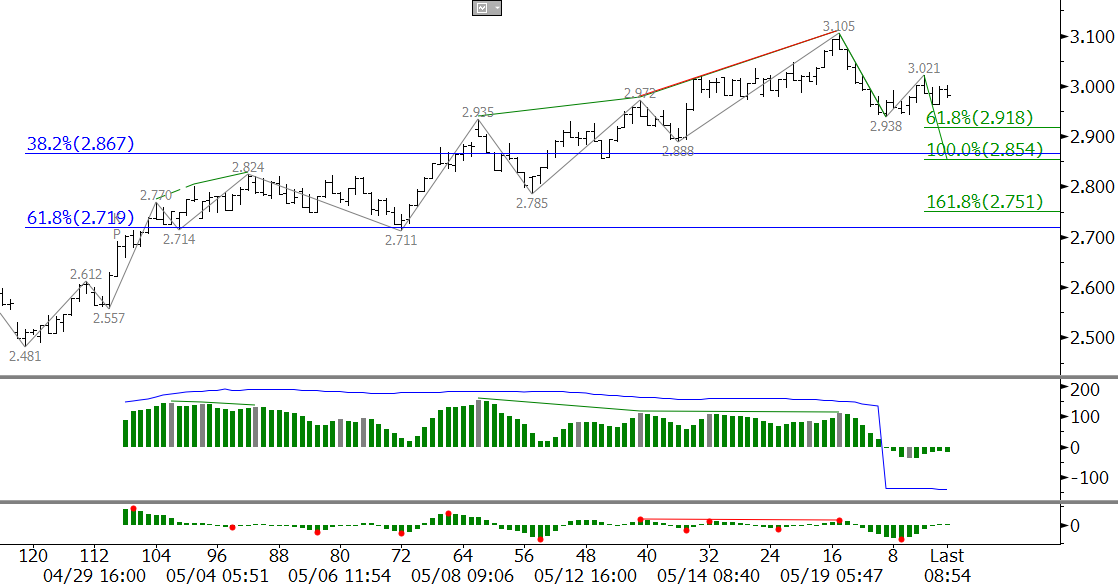
For the past few weeks many traders have doubted the rationality of natural gas’ price surge and have been looking for a stalling point. It is hard to argue with the charts though, and our analysis, based purely on what is happening on the charts, has called for $3.05 as a potential stalling point. We have stated in our weekly Natural Gas Commentary that a correction from $3.05 would likely take place as long as it held on a closing basis. The $3.05 target was overcome by the $3.105 swing high, but Tuesday’s blow-off high and key-point reversal on the daily chart, KasePO and KaseCD divergences on the $0.035 Kase Bar chart shown below, and failure to close over $3.05 indicate the move up has stalled and the anticipated downward correction is now underway.

Today’s close below $2.92, the 0.618 projection of the wave down from $3.105, opens the way for $2.85. We are looking for the correction to extend to at least $2.85 and possibly $2.73 over the next week or so. Tomorrow’s EIA number will not likely influence the downward correction unless it is extremely bullish and out of line with expectations.
Ultimately, we see that support between $2.85 and $2.73 will hold and a trading range similar to the one experienced from mid-February until late March between approximately $2.73 and $3.05 will ensue while the market awaits directional confirmation from summer weather and/or other related factors.
For a more detailed analysis and in-depth natural gas forecast take a trial of the Kase Commentary on Natural Gas today!

